Overview
BERDO is a local law that aims to reduce emissions from large buildings. Building owners must annually report energy and water consumption and comply with emissions limits that become more stringent over time, with all buildings expected to achieve net-zero emissions by 2050. BERDO covers the following buildings:BERDO Resources
Filing & Reporting
Property owners are required to file reports with the City of Boston every year.- Filing Deadline (May 15th): Energy & water performance reports must be filed by May 15 of each year for the previous calendar year.
- Third-Party Data Verification: Data verification reports must be submitted by a certified professional in the first year of reporting and then every five years thereafter
- Compliance Phases: Starting in 2025 for buildings ≥ 35,000 sq. ft. and 2030 for those between 20,000 - 34,999 sq. ft. Also includes residential buildings with 15+ units.
Configuration
Follow these steps to ensure that the property is ready for compliance analysis:- Confirm the selected Reporting Period: Emissions calculations, penalty values, and decarb pathways all depend on the selected reporting period. Change the reporting period to see how property performance over different 12-month time frames impacts compliance.
- Click on Details button to ensure that there is a high Data Completeness value associated with the reporting period. Data completeness should be as close to 100% as possible to ensure accurate analysis.
Calculating Emissions Limits
A building’s emissions limit is based on the breakdown of its property uses as tracked in ESPM. Abisko automatically calculates a property’s emissions limits and transparently displays each step of the calculation process.ESPM Property Uses
Abisko retrieves all ESPM property uses associated with the property along with corresponding floor areas. Users can view all property uses and how they map to BERDO property use types in the following report table, which is located near the bottom of the report.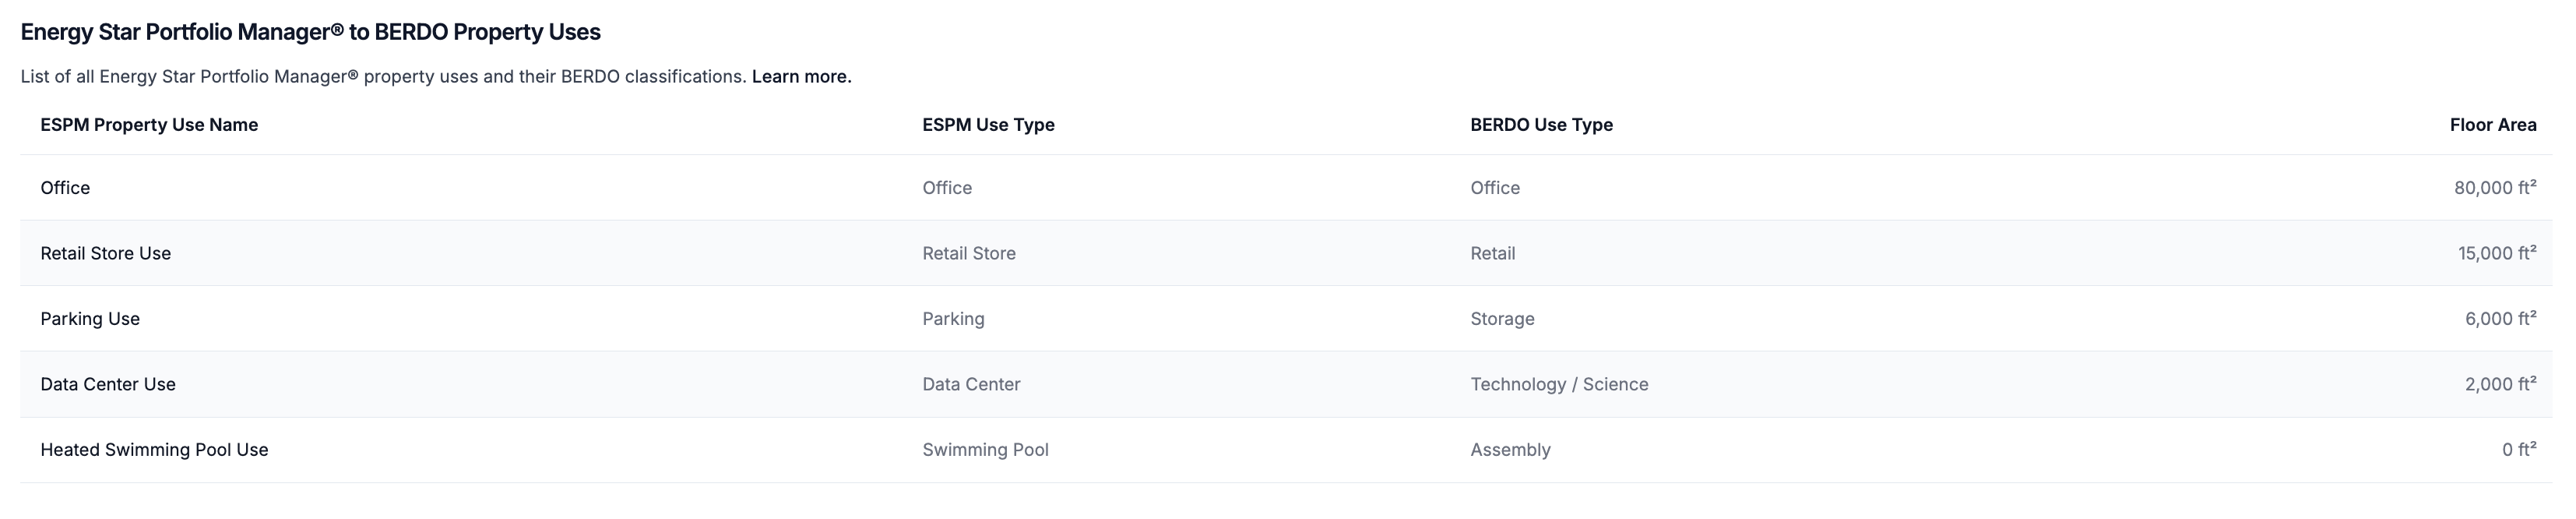
Primary Use Type Adjustments
Abisko aggregates floor areas by property use type and calculates emissions limits for each type and compliance period. These limits are determined by multiplying the total floor area of each property use type by its corresponding emissions factor. If a building has only one property use type that represents more than 10% of its GFA, its limit is calculated by applying the emissions limit for that primary use type to the building’s total GFA. Buildings with two or more primary use types, each accounting for at least 10% of the total GFA, may instead apply a blended emissions limit. Following BERDO guidelines, Abisko automatically adjusts property use floor area totals by reallocating any non-primary use floor area to the largest primary use type and clearly presents these adjustments in the BERDO report.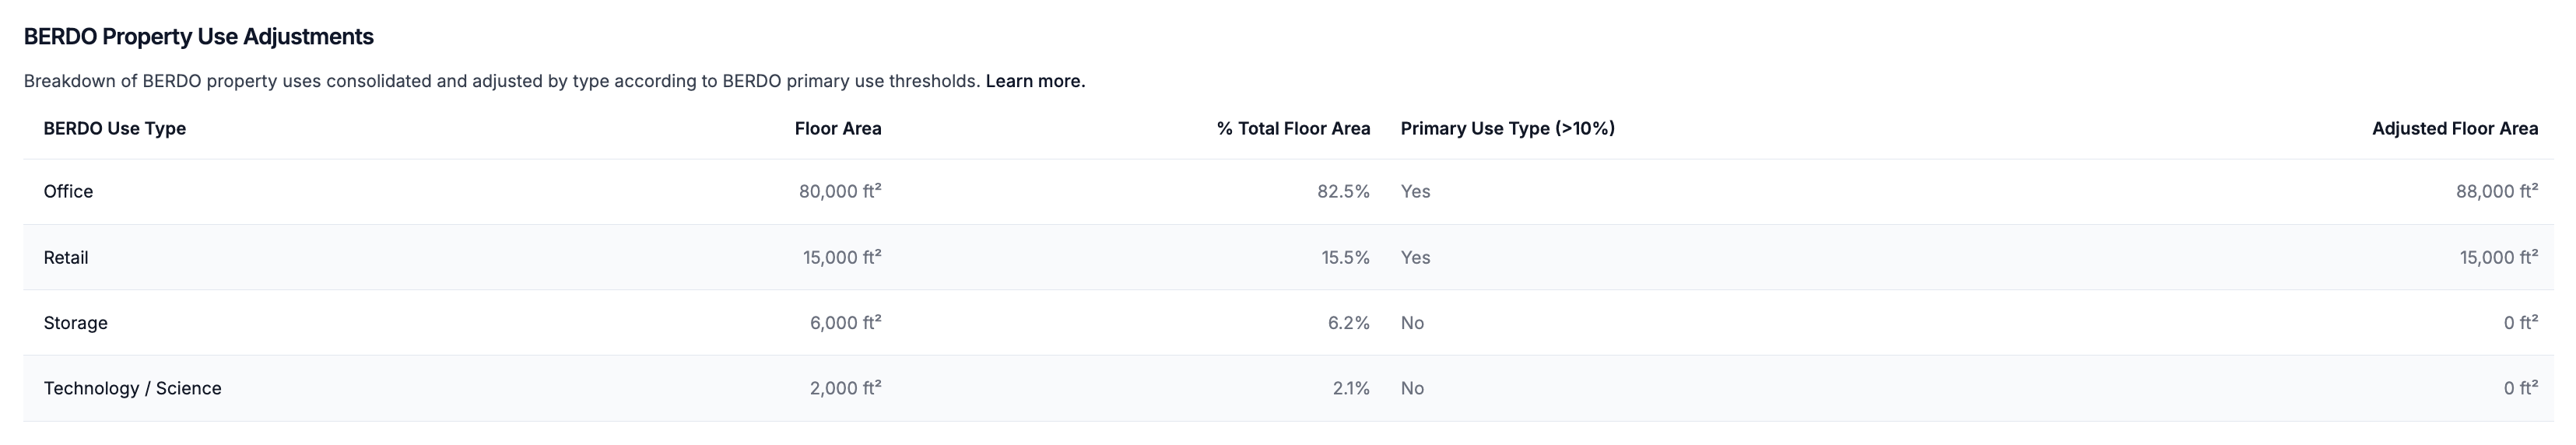
Property Use Type Emissions Limits
Abisko displays a table of all BERDO property use types and their corresponding emissions limits at the bottom of the report.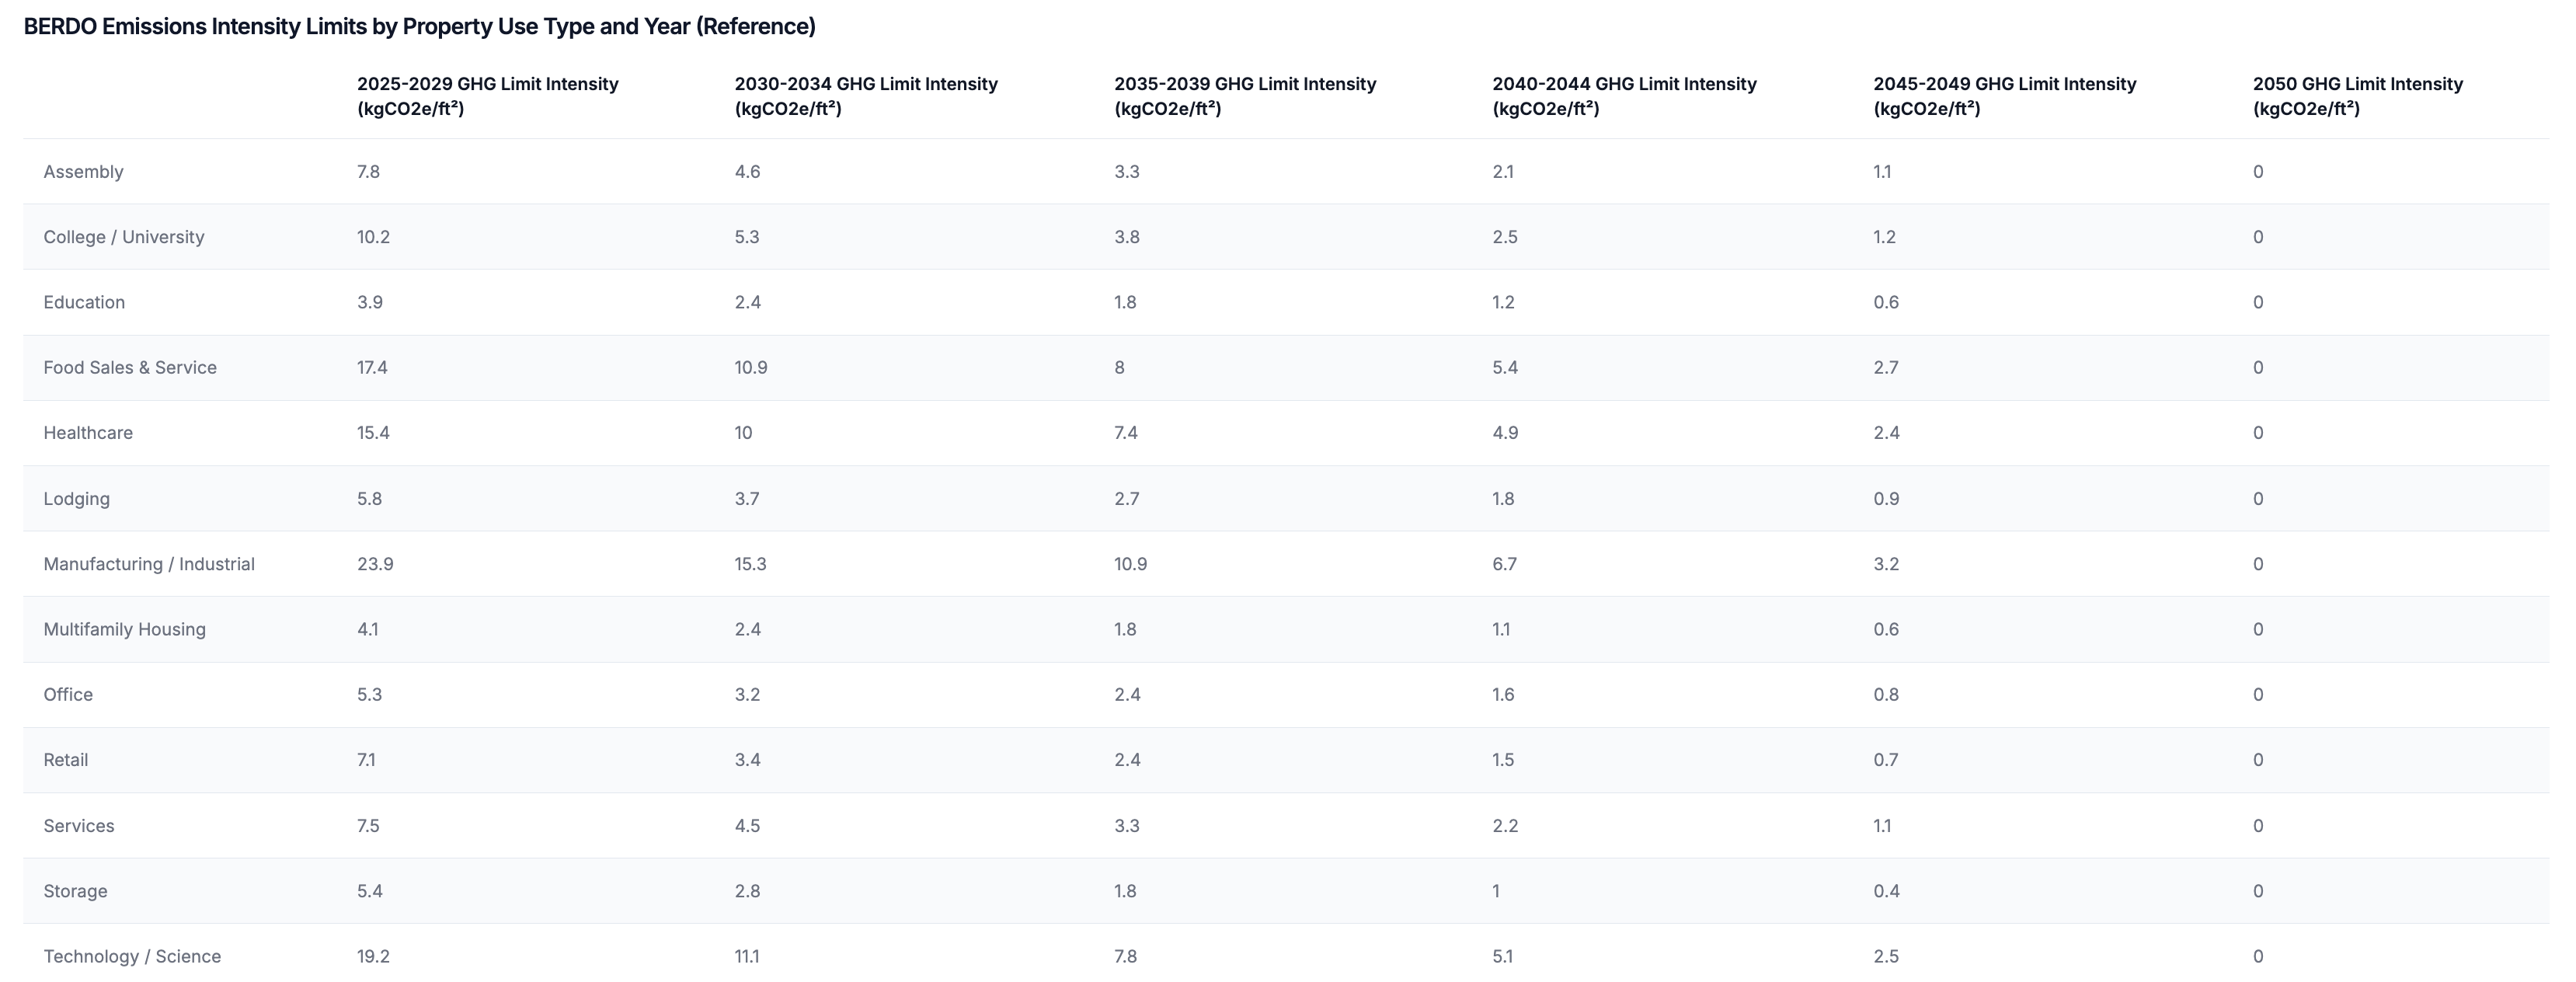
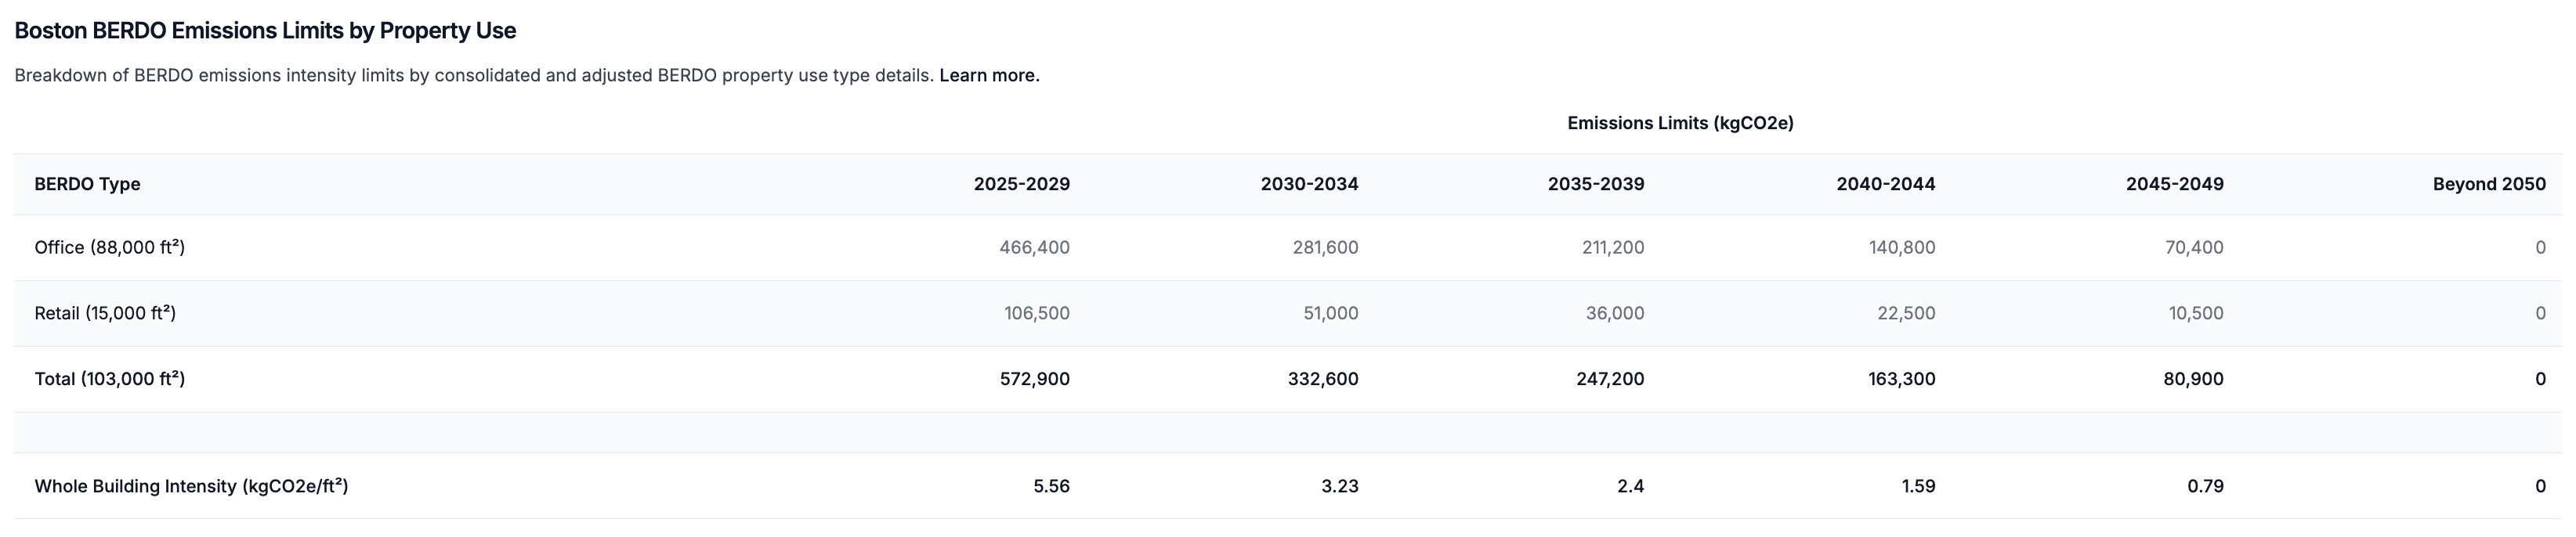
Total Emissions Limits
The total emissions limit is calculating by taking the sum of all component primary use type limits for each compliance period.
- BES = Blended Emissions standard, measured in kg CO2e/sq. ft./year
- SF = square footage of a primary Building Use
- ES = Emissions standard of a primary Building Use, as defined by the Ordinance
- SF1= square footage of the largest primary Building Use
- ES1= Emissions standard of the largest primary Building Use
- SFnp = total square footage of all non-primary Building Use
Calculating Penalties
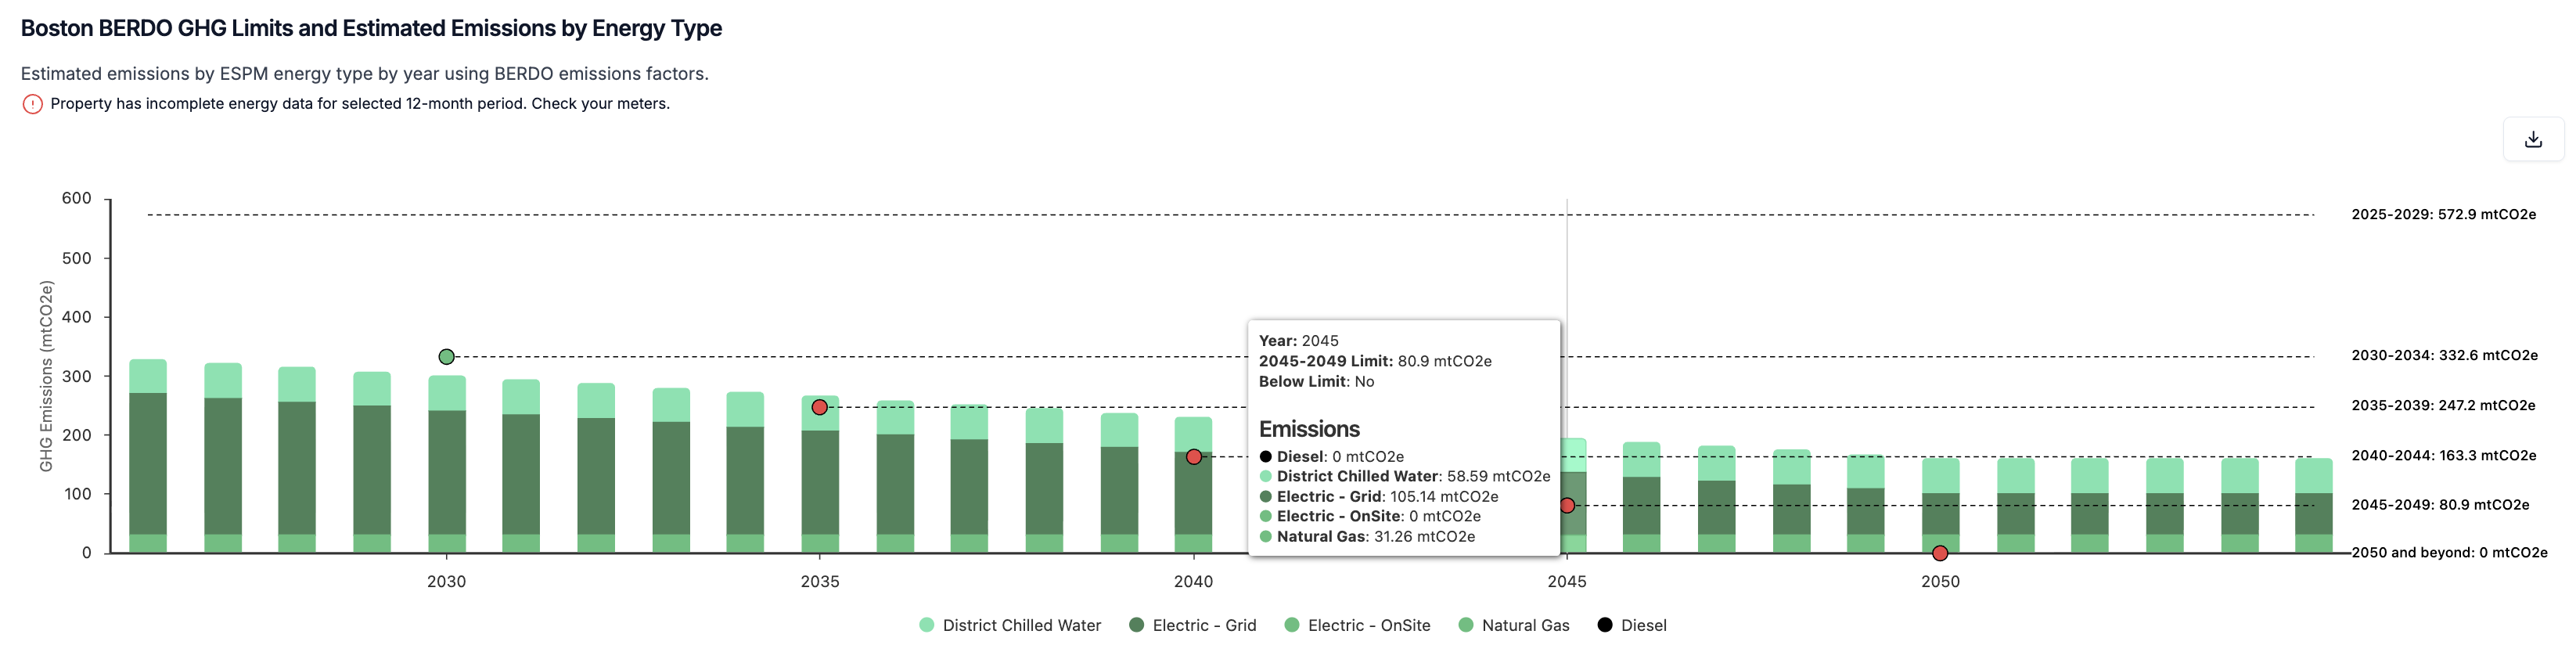
To assess potential non-compliance penalties over time, a property’s annual energy use must be calculated for each energy subtype (e.g. electricity, natural gas, district heating), converted into annual emissions using BERDO factors, and compared against the property’s annual emissions limit to determine any penalties. Abisko performs this entire process automatically based on the selected reporting period.Property Emissions
Property emissions are calculated by multiplying the property’s total annual consumption of each energy subtype by the corresponding emissions factor and summing the results. The electricity emissions factor assumes an electric grid with lower carbon intensity over time.For example, the grid - electricity emissions factor drops annually from 265 kgCO2e per MWh in 2028 to 150 kgCO2e per MWh in 2050, reflecting a drop in future electricity-related emissions.
Exceedance & Penalties
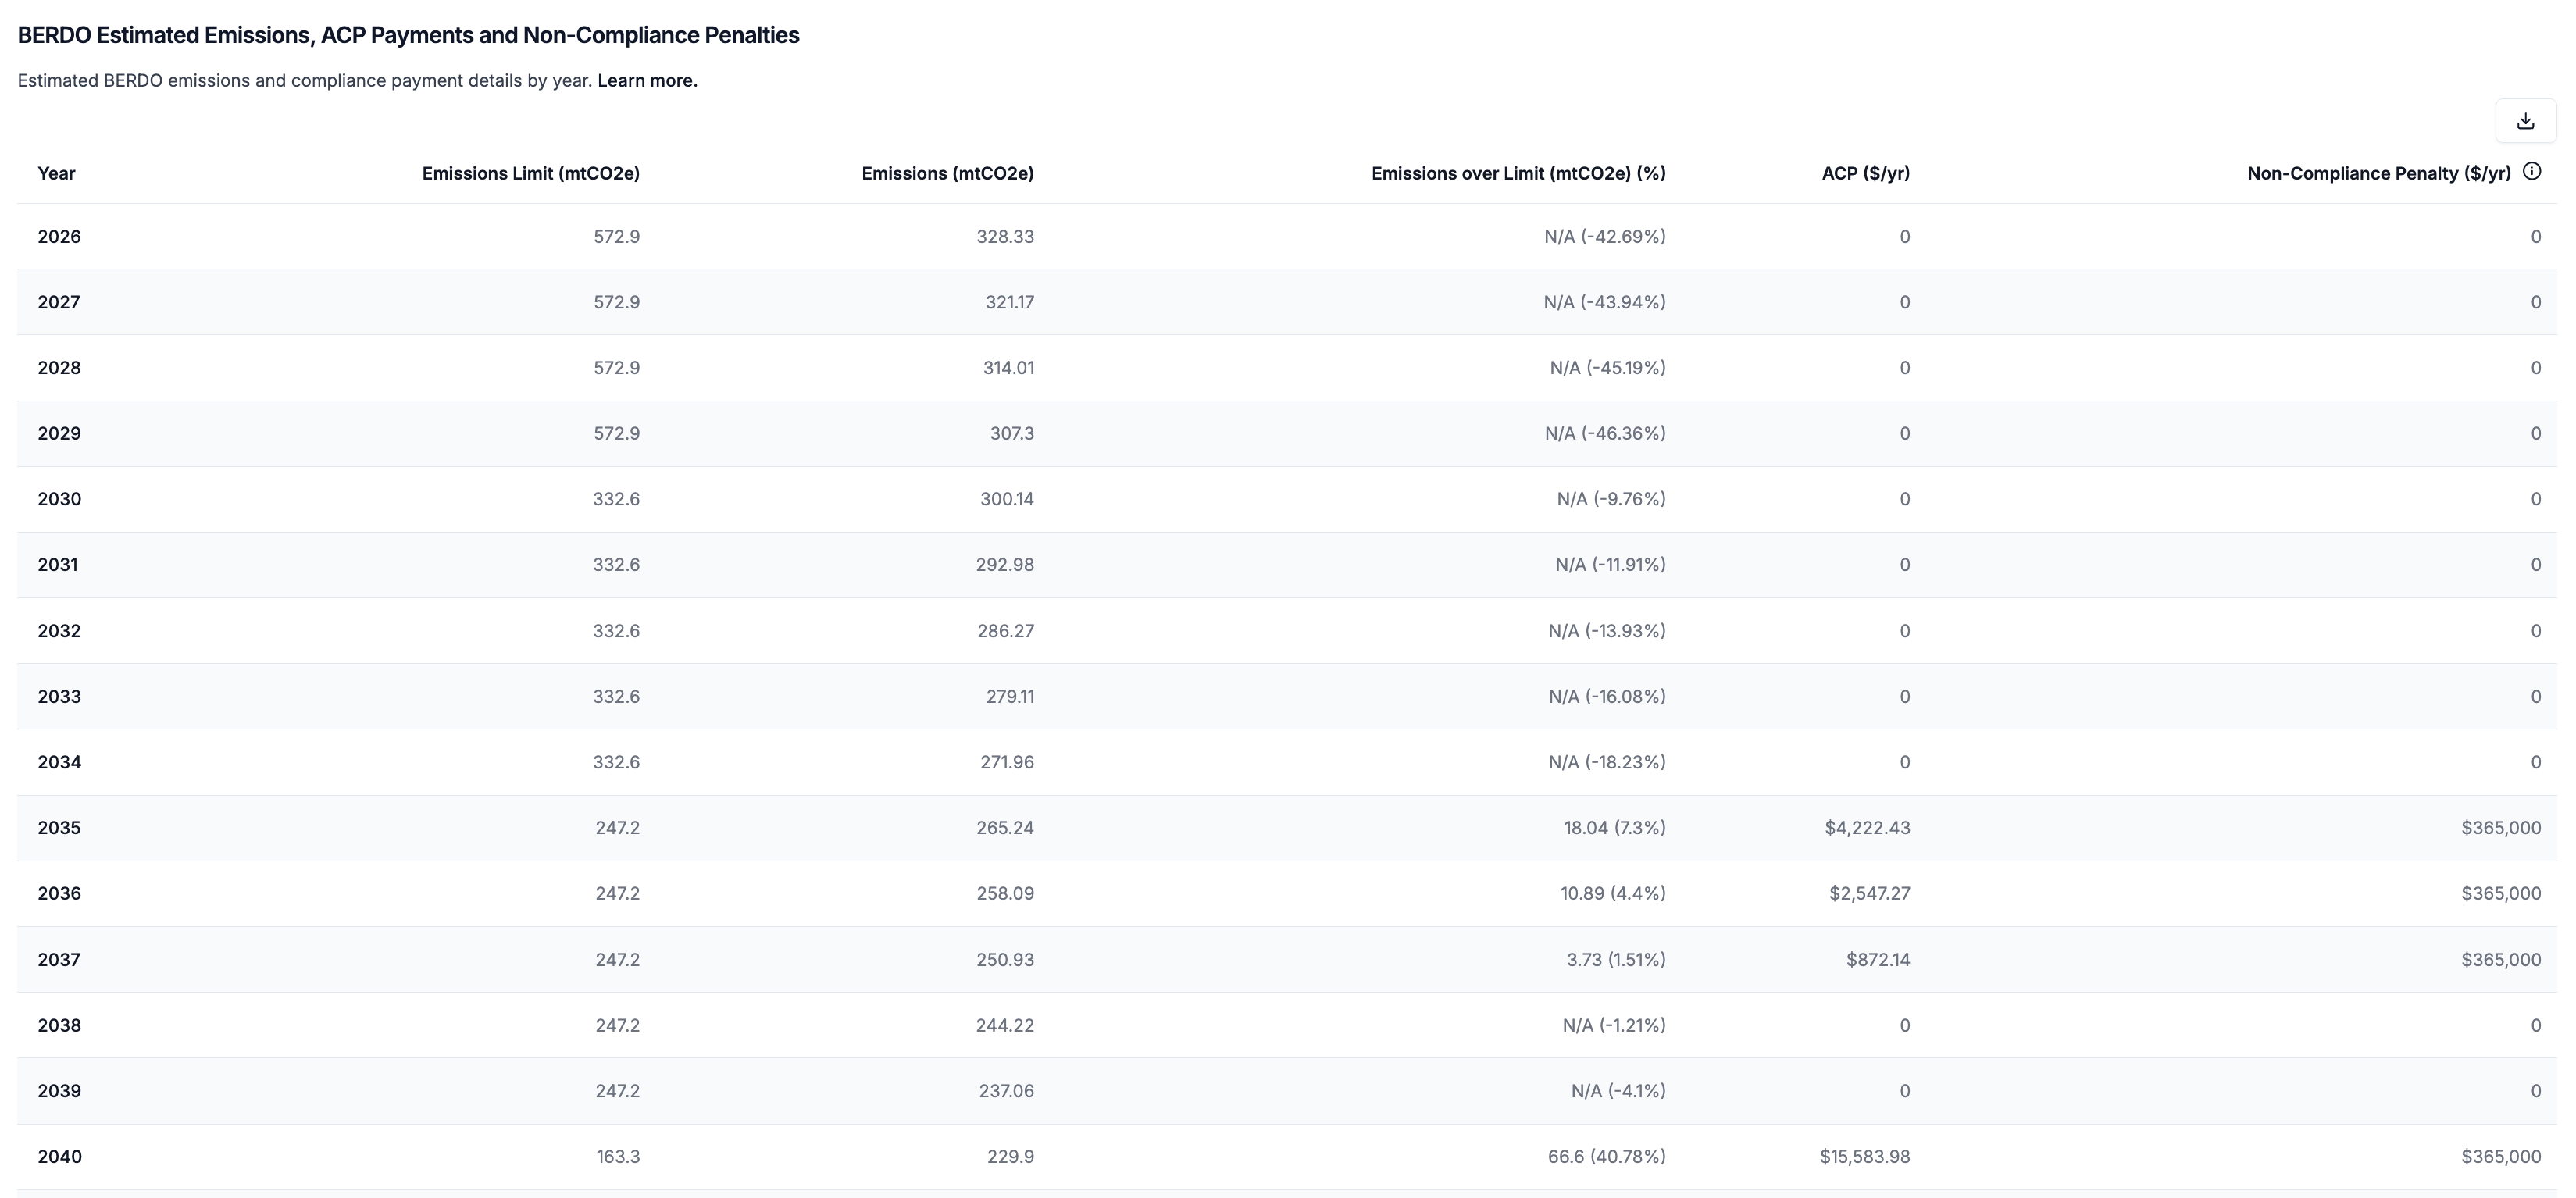
Under BERDO, non-compliance penalties are calculated by determining the difference between the building’s actual emissions and its emissions limit, then multiplying that excess by a daily penalty rate depending on the size of the building.Alternative Compliance Payments
Buildings may mitigate emissions from energy use by paying an Alternative Compliance Payment (ACP) of $234 per metric ton of CO2e per year. Users can view a plot of projected annual non-compliance penalties and ACP totals for each year through 2050.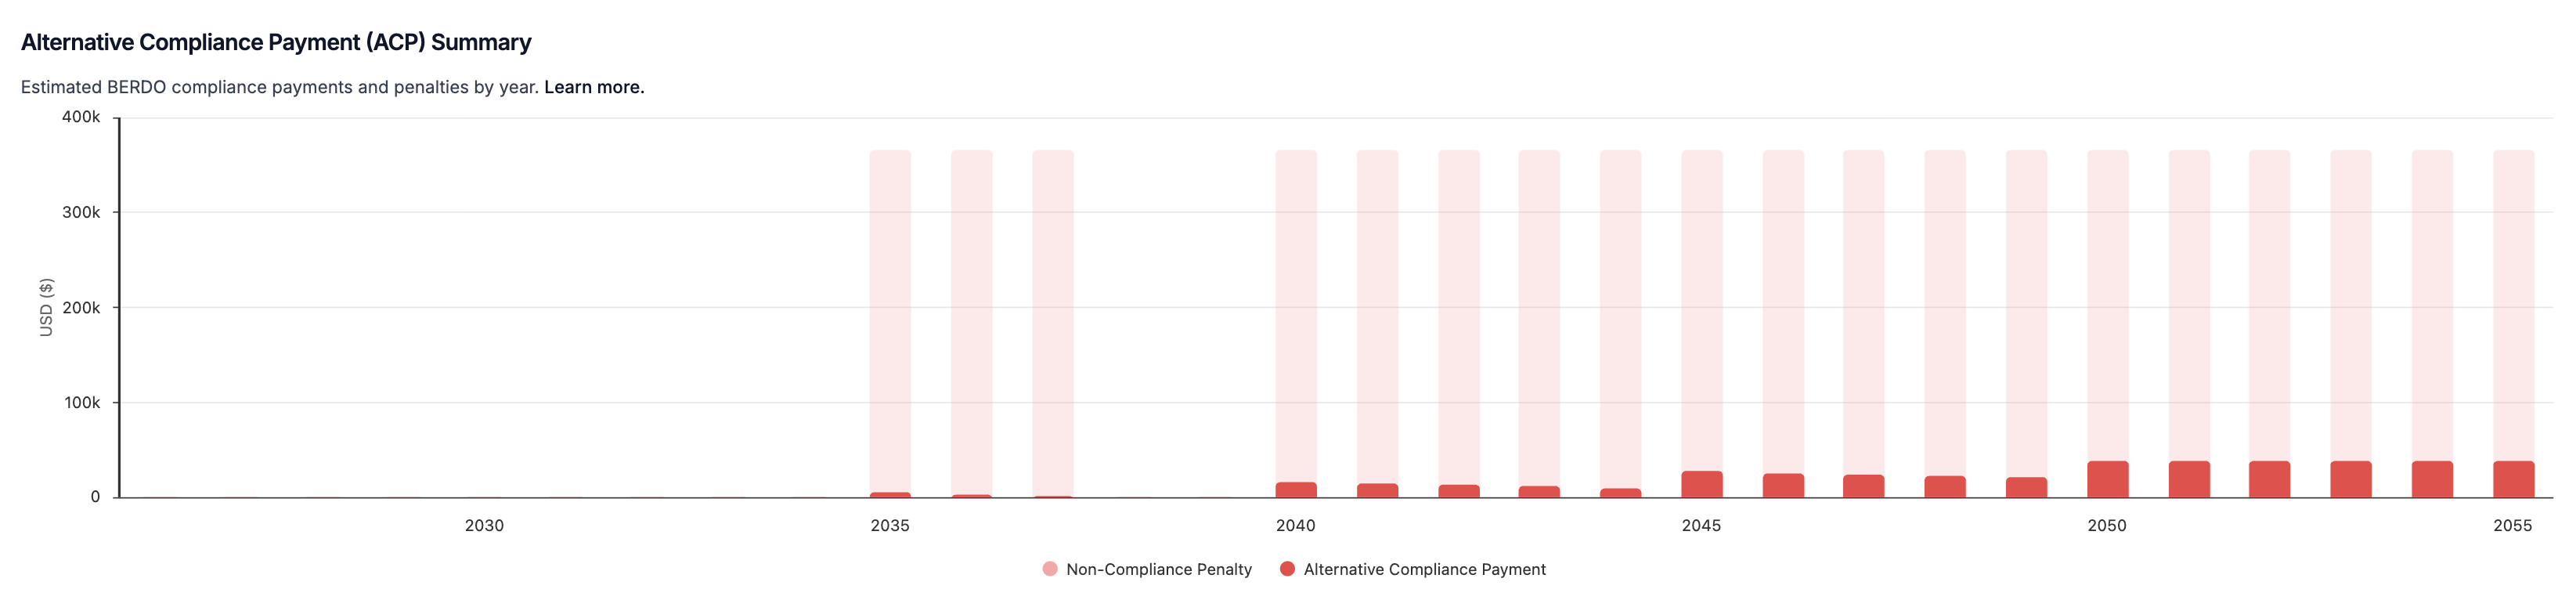
Setting Custom Limits
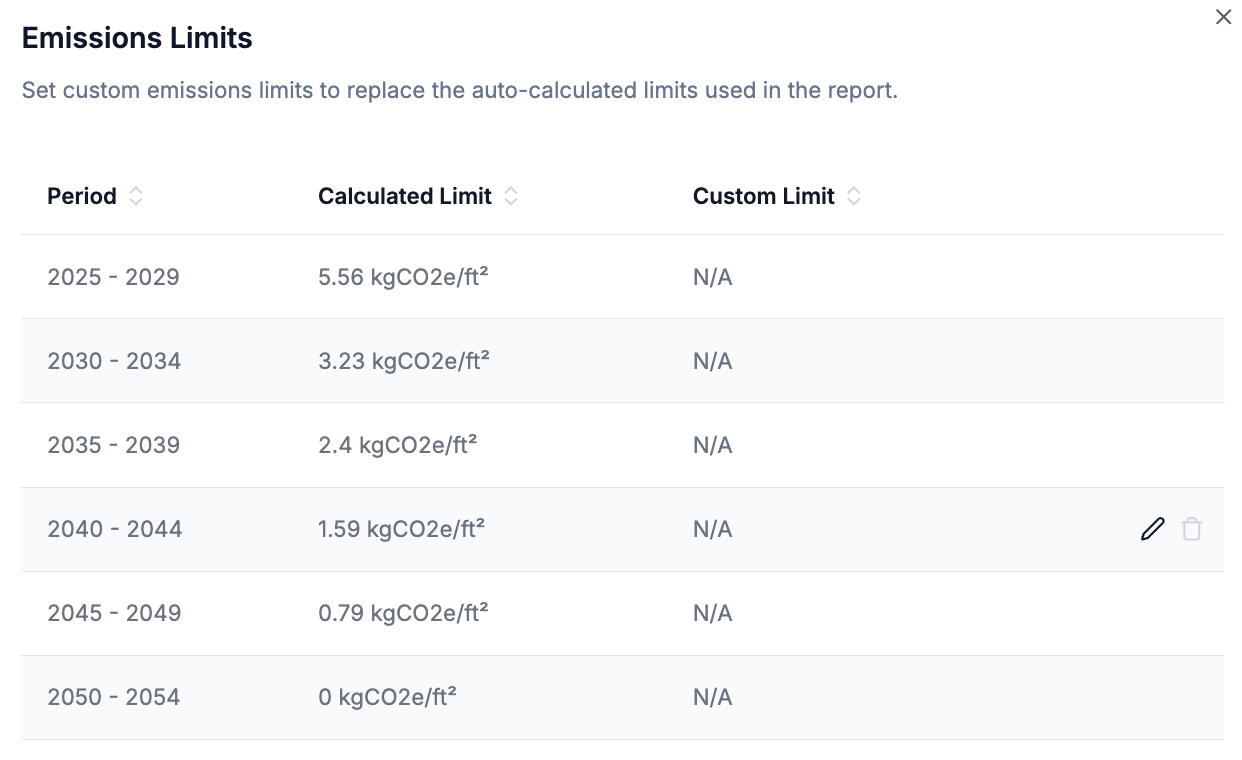
Abisko automatically calculates emissions and emissions limits using the default methodology outlined in BERDO’s published technical guidance. In some cases, however, buildings may be subject to alternative prescribed limits, or users may wish to evaluate non-compliance penalties under different limit assumptions. To support these use cases, Abisko allows users to define custom emissions limits for each compliance period. Once custom limits are applied, Abisko automatically recalculates all compliance metrics and penalty estimates using those values. If no custom limits are defined, Abisko uses the default calculated limits.To Add/Edit/Delete Custom Limits
Property → Compliance → Exposure → Boston - BERDO- Click on the Set Limits button
-
Open the BERDO Emissions Limits sidebar
- To add/edit a custom limit
- Hover the mouse over the row in the table for the limit you would like to edit
- Click the edit icon that shows itself on the right side to open the sidebar
- Edit the limit and save
- To delete a custom limit
- Hover the mouse over the row in the table for the limit you would like to delete
- Click the trash icon that shows itself on the right side to delete
- To add/edit a custom limit
Decarbonization Pathways
Abisko enables users to evaluate the impacts of proposed energy measures on property emissions within the context of BERDO. Users can model different combinations of measures and see how each scenario affects emissions levels and non-compliance penalties through 2050. This allows users to align long-term decarbonization strategies with Building Performance Standards (BPS) requirements and capital planning efforts. With this feature, users can:- Test different decarbonization pathways and their regulatory exposure
- Identify the most cost-effective emissions reduction strategies
- Prepare and submit decarbonization plans to local regulators
Select Renewables Scenario
Building owners can reduce emissions by purchasing offsite electricity generated from renewable sources. At the top of the report, users can select from several options to see how total emissions and penalties change based on different clean energy suppliers. Click here to learn more.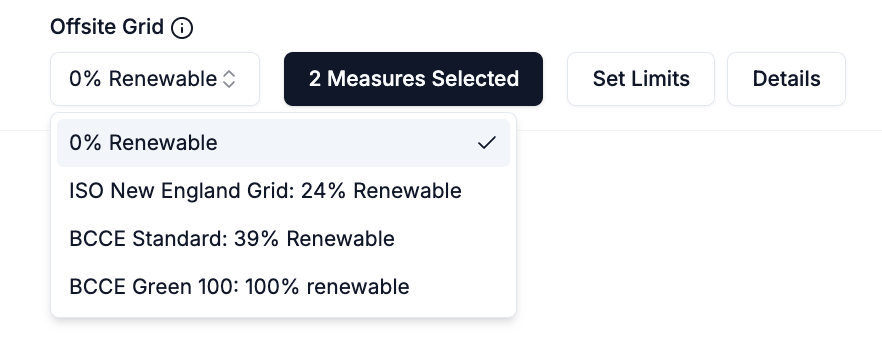
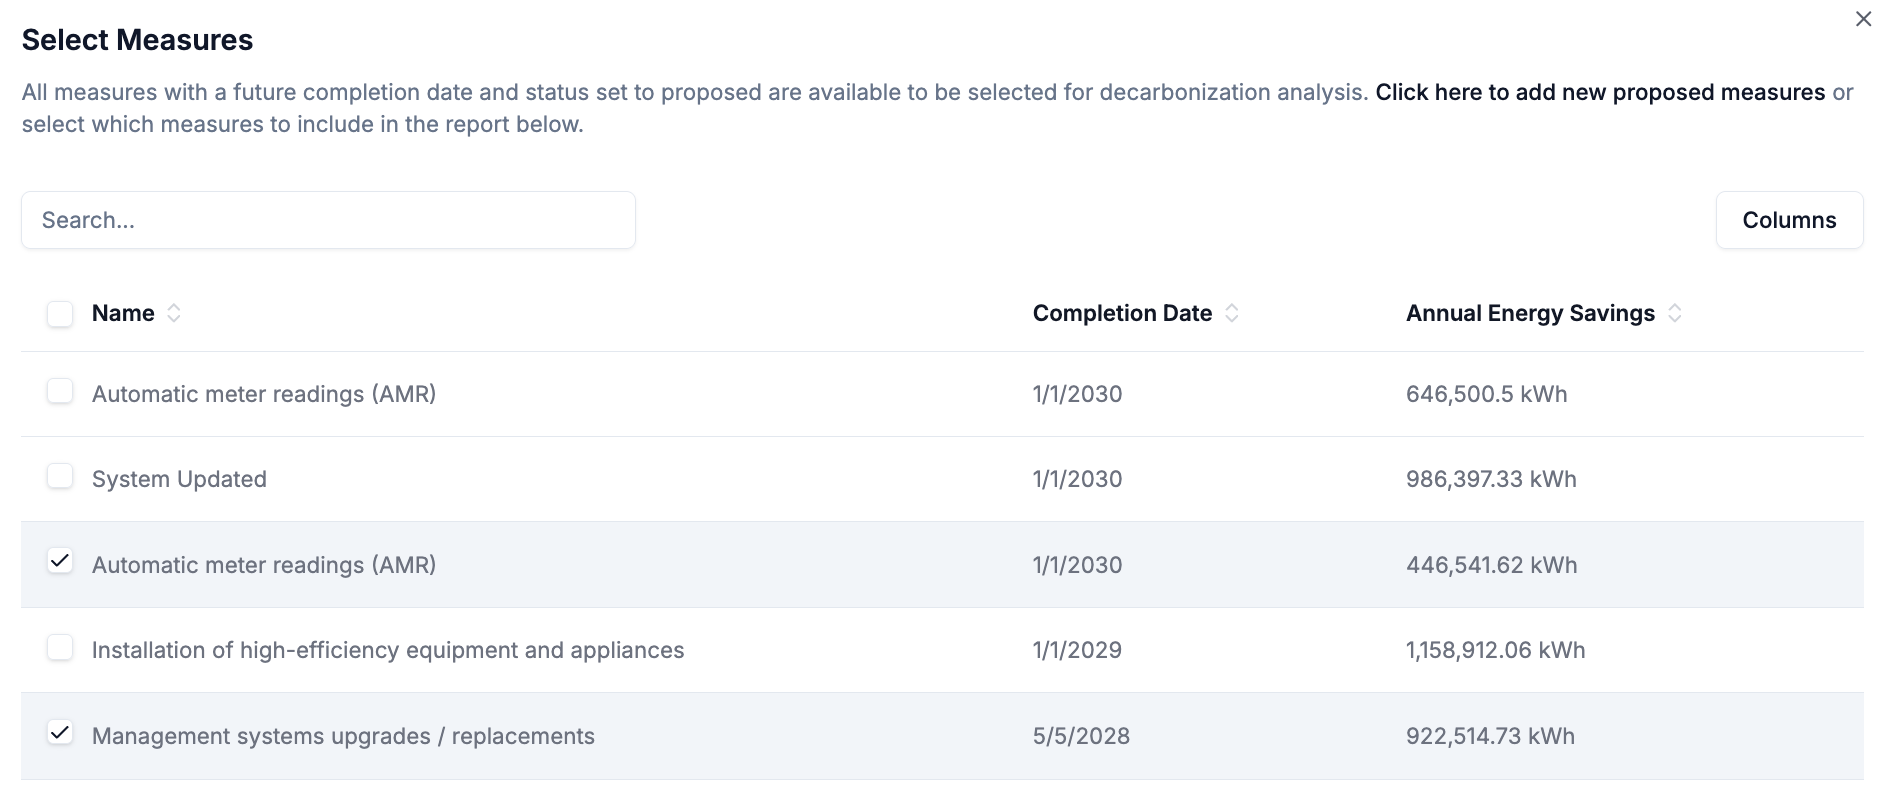
Select Measures
Property → Compliance → Exposure → Boston - BERDO- Click on the Select Measures button
-
Open the BERDO Measures Selection sidebar
- Check the box next to each measure that should be included in the compliance analysis
- Check the box above the table to automatically select all measures
- Click save after finalizing the measure selection
- Check the box next to each measure that should be included in the compliance analysis
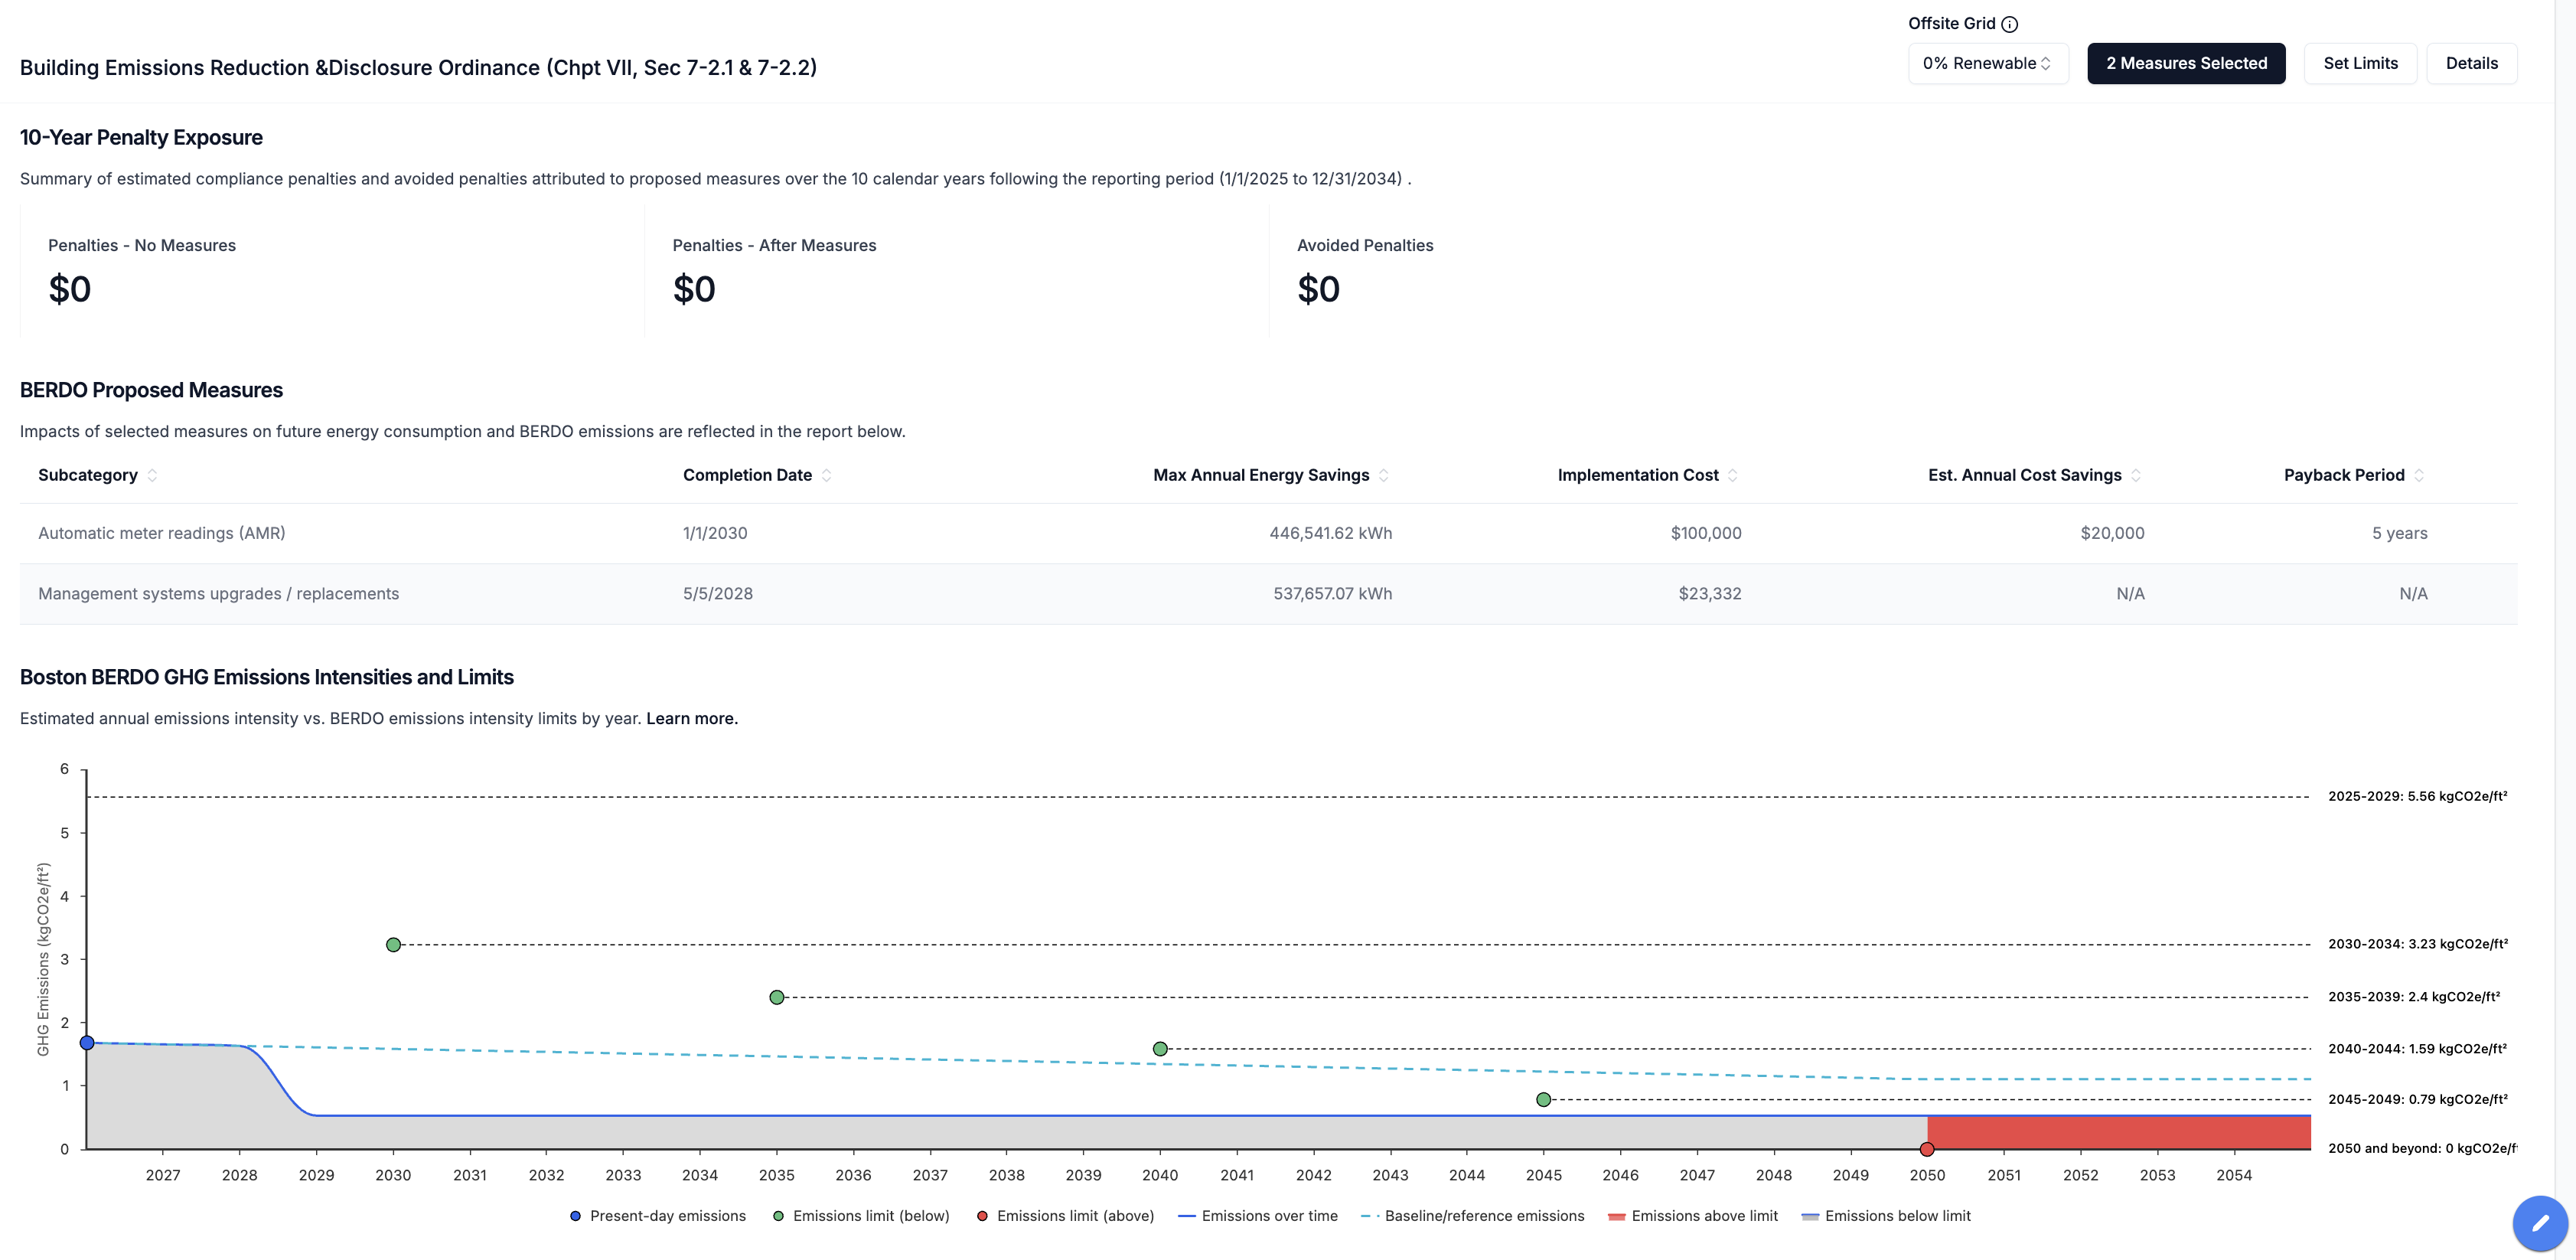
Review Charts & Tables
After saving all selected measures, all charts and tables in the report will automatically update to show the impact of each measure on the property annual emissions and non-compliance penalties.- Proposed measure impacts will begin to take effect on the calendar year following the completion date of the measure.
- e.g. if completion date = 5/5/2028, changes begin to take effect 2029
- Absolute values entered for each energy subtype (e.g. electric, natural gas) are subtracted from the total annual consumption of that subtype for the selected reporting period.
- Percentage values entered for each energy subtype are converted to absolute values by multiplying the percentage by the total annual consumption of that subtype for the selected reporting period. The converted value is then treated as an absolute value.
- Measures are applied independently (no interactive effects) and total reductions for each energy subtype are capped by the total subtype consumption of the reporting period.
- e.g. If 20 measures include 10% annual electricity savings, this will be capped to 100% annual electricity savings, resulting in 0 electricity-related emissions
- Annual energy savings are additive and persist over time