The Penalties tab provides a view of estimated non-compliance costs associated with policies tracked across the portfolio. It projects exposure over a 10-year horizon and breaks down penalties by policy, year, and status, so that users can prioritize capital projects to reduce energy and minimize risk across their portfolio.
Adding Penalties
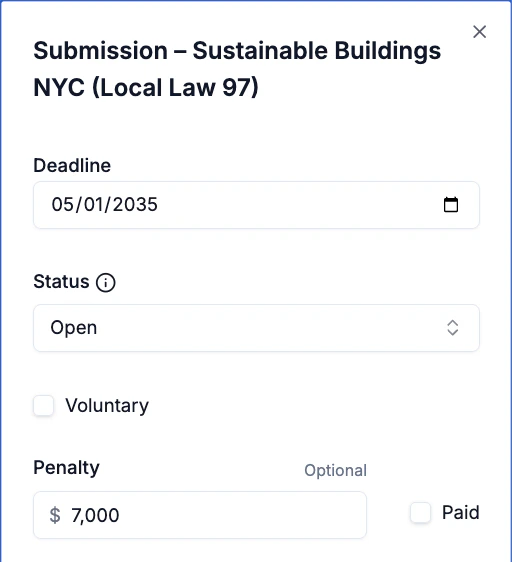
When creating or updating a submission for a policy, users can add estimated penalties to track financial exposure across multiple compliance cycles.
To estimate penalties for more complex Building Performance Standards, users can leverage Abisko’s BPS analysis features to automatically calculate projected penalties for all major BPS policies over time.
- Example: Users can calculate projected NYC Local Law 97 penalties through 2050 and track values for future submissions across multiple compliance cycles.
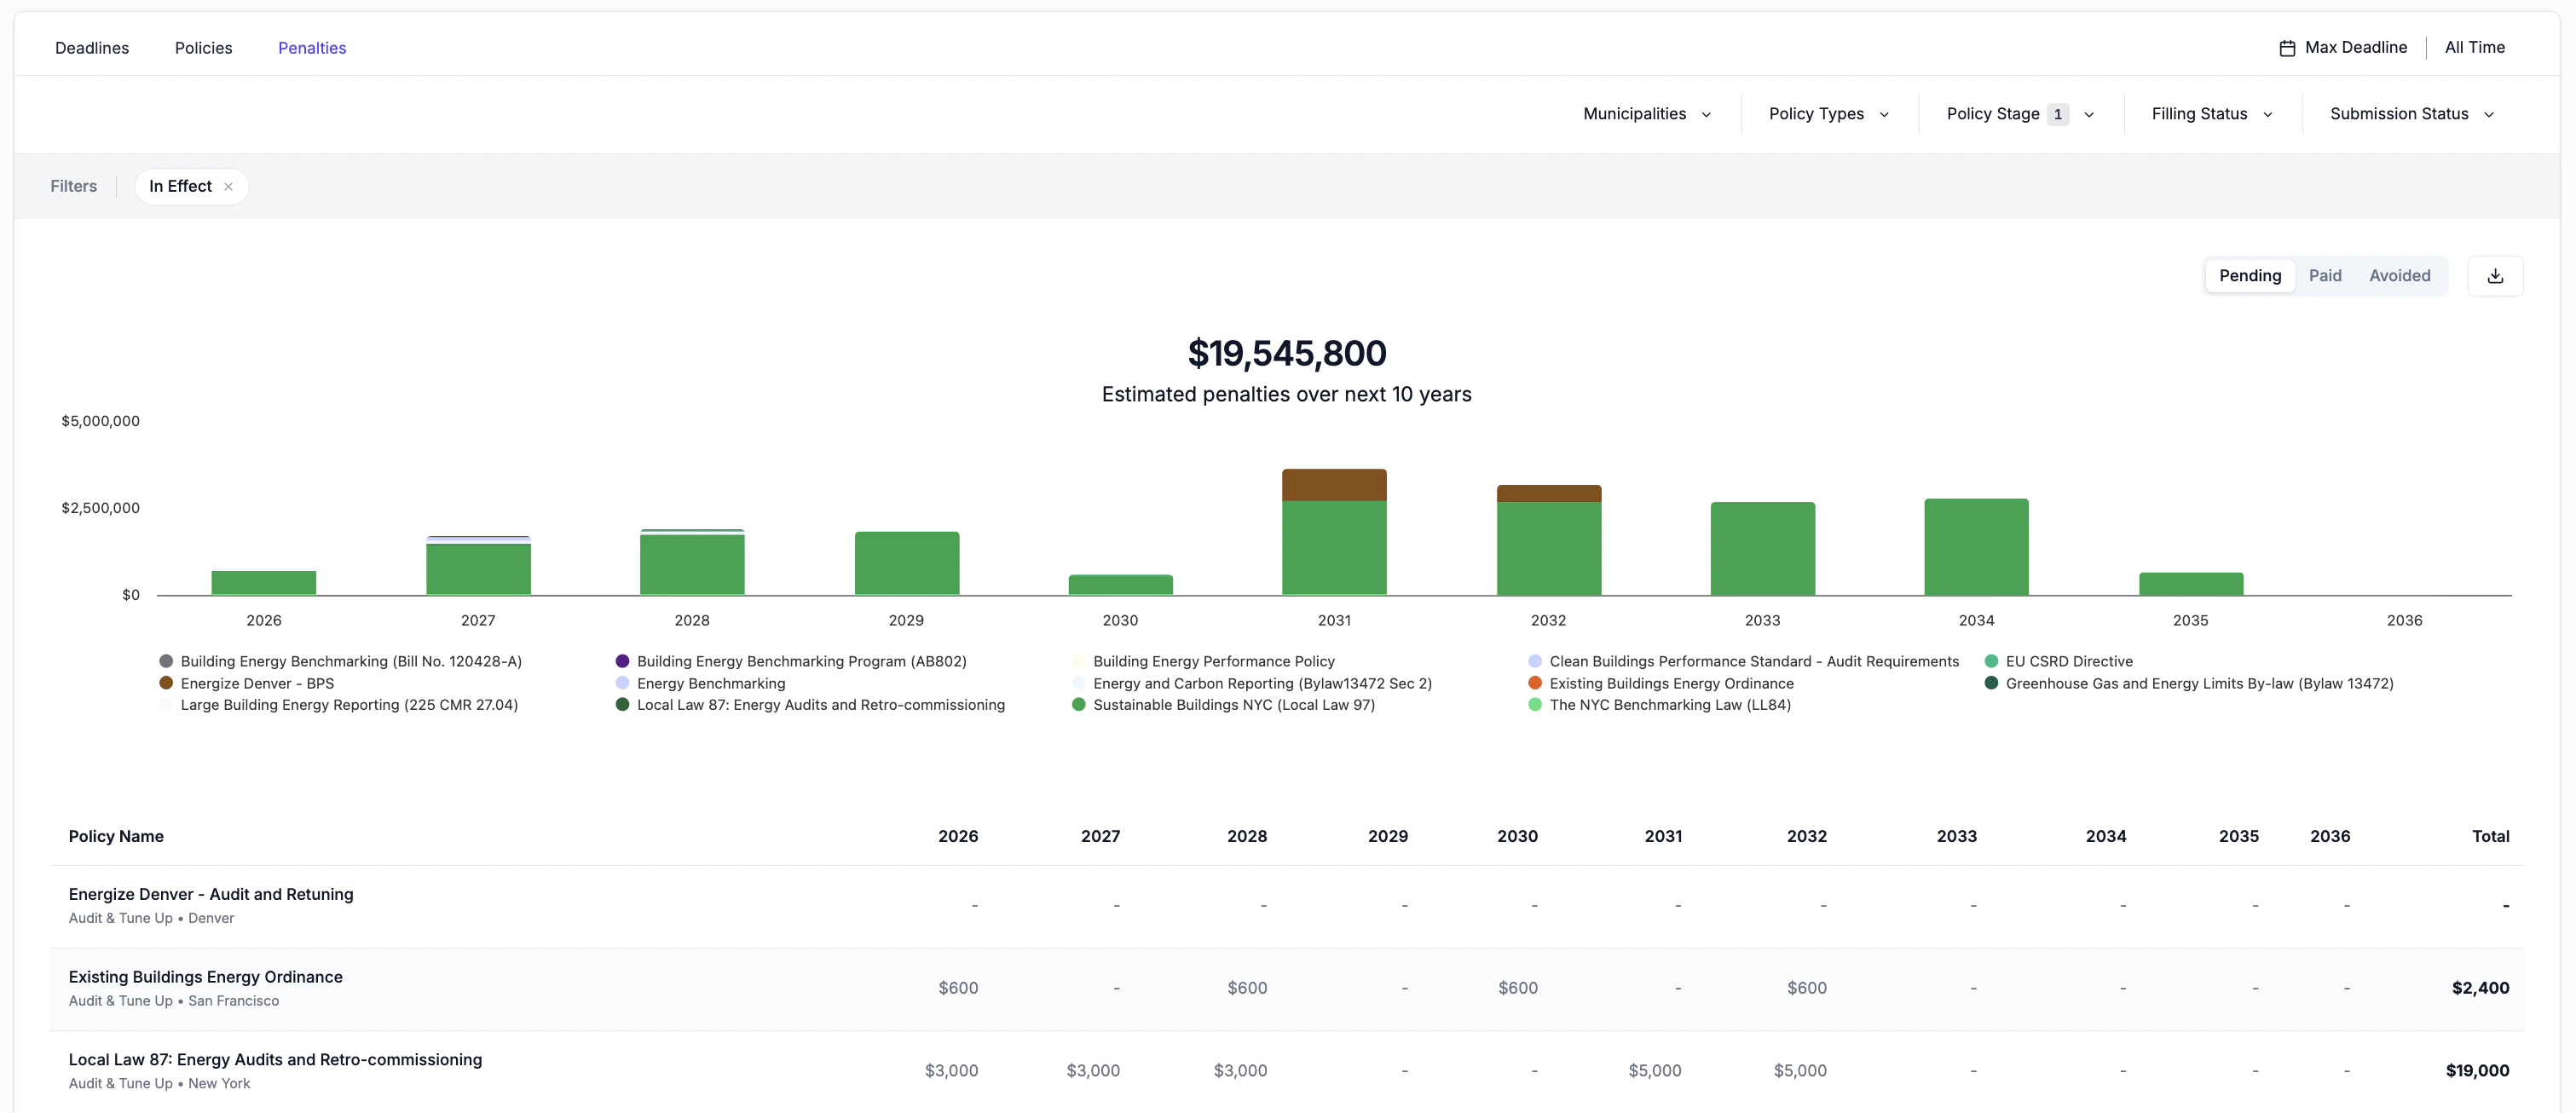
Abisko aggregates penalties associated with all submissions with deadlines that fall within a given year into portfolio-level views that can be filtered to show trends across policies, municipalities and individual properties.
Leverage bulk import templates to quickly add submissions and penalties for properties across your portfolio.
Tracking Exposure
Users can view projected penalties for all tracked submissions across their portfolio over multiple years. Each total represents the sum of all penalties associated with submissions for a particular policy with a deadline in the given year.
Users can use the filters above the plot to analyze penalties across specific municipalities, policy types, submissions statuses and deadlines.
Policy-level Trends
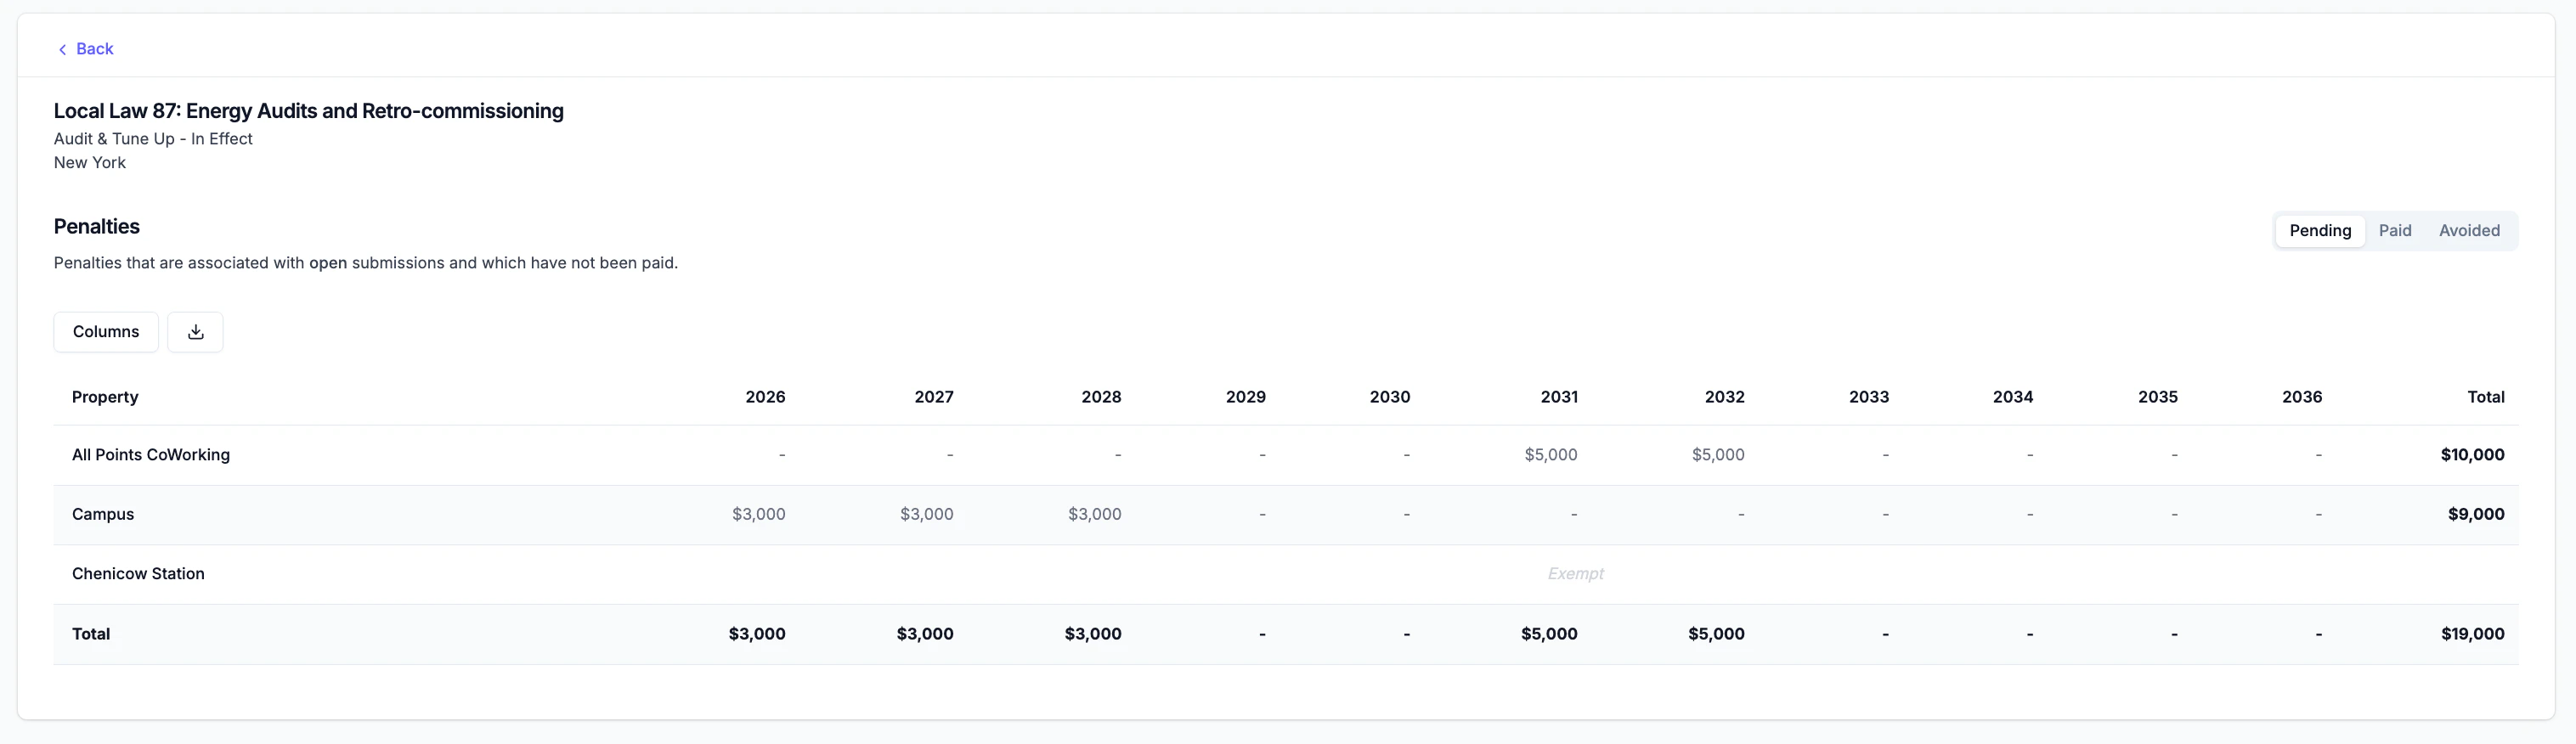
Users can click on the name of a policy in the table to view a breakdown of penalties for every building subject to that policy. This allows users to prioritize specific buildings across jurisdictions for energy efficiency investments.
Click the Back button to return to the portfolio-level view across all policies.
Penalty Status
Penalties tracked for each submission are classified into one of three statuses:
- Pending: Penalties estimated for properties that have not yet achieved compliance. These represent active financial risk.
- Paid: Penalties that have been incurred and recorded as paid. Users can check the Paid checkbox next to the penalty value to indicate that the penalty was paid.
- Avoided: Penalties that were projected but ultimately not incurred, typically because compliance was achieved before the deadline.
Users can toggle the penalty status above the plot to track pending (i.e. current financial risk), paid (i.e. pas financial penalties) and avoided (i.e. risk mitigation) penalties that resulted from energy efficiency investments.