How It’s Calculated
Data Completeness (%) is calculated at multiple levels:- Meter: Every meter has a data completeness (%) for each 12-month reporting period as well as for the entirety of the meter activation period (i.e. all-time).
- Property: Every property has a data completeness (%) for each 12-month reporting period for each utility type and subtype aggregated across all meters, including:
- Energy: Total Energy, Total Electricity, Total Fuel, Total District Heating & Cooling
- Emissions: Total Emissions, Direct Emissions, Indirect Emissions, Scope 1/2/3 Emissions
- Water: Total Water, Potable Water, Reclaimed Water, Well Water
- Portfolio: Each portfolio presents data completeness (%) for each 12-month reporting period for each utility type and subtype aggregated across all properties.
Data Completeness = (Actual Days with Data / Expected Days with Data) × 100%
Meter-level Calculation
How data completeness (%) is calculated for an individual meter Example: The electric meter pictured below has data for all months in a 12-month reporting period except July and August. The property is owned and the meter is active is over all 12-months.
- Expected days with data = 365
- Actual data with data = 303
- Meter Data Completeness = 303 / 365 = 83%
Property-level Calculation
How data completeness (%) is calculated for at the property level Example: A property has 4 energy meters (3 electric; 1 fuel). The property is owned and all meters are active over all 12-months of the reporting period.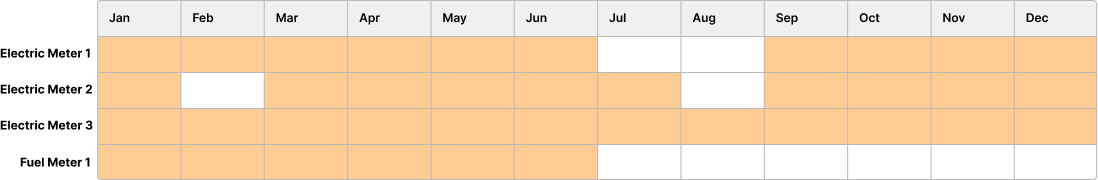
- Electric Meter 1: Data Completeness = [303 / 365] = 83%
- Electric Meter 2: Data Completeness = [306 / 365] = 84% (Note: February has 28 days)
- Electric Meter 3: Data Completeness = [365 / 365] = 100%
- Fuel Meter 1: Data Completeness = [184 / 365] = 50.4% (Note: 6-month end gap)
- Total Electricity Data Completeness = [303 + 306 + 365] / [365*3] = 89%
- Total Fuel Data Completeness = 184 / 365 = 50.4%
- Total Energy Data Completeness = [303 + 306 + 365 + 184] / [365*4] = 79.3%
Tracking Data Completeness
Abisko calculates and reports performance metrics with corresponding data completeness values throughout the platform to allow users to decide whether to report incomplete data as-is or address the issues to increase data completeness.Property Level
View meter-level and property-level data completeness in multiple property locations. Navigate to Property → Data Quality- View a summary of data completeness (%) & data quality metrics by utility type and meter

- View a summary of data completeness (%) & performance metrics by utility type
- View all-time and reporting period data completeness (%) for every individual meter

Portfolio Level
View property-level and portfolio-level data completeness in multiple portfolio locations. Navigate to Property → Portfolio Trends → Energy / Emissions / Water- View portfolio-level data completeness (%) & performance metrics by utility type
- View data completeness (%) & performance metrics for each property by utility type
