Setting the Reporting Period
The reporting period defines the 12-month window over which performance data is reported across properties and portfolios. It defaults to the year ending with the most recently completed calendar month. After logging in, users should set or adjust the base and reporting periods to the timeframes they wish to analyze.Once set, base and reporting periods persist as users navigate between properties and portfolios.
- Click on the Reporting Period button at the top of any relevant tab (below the tab names)
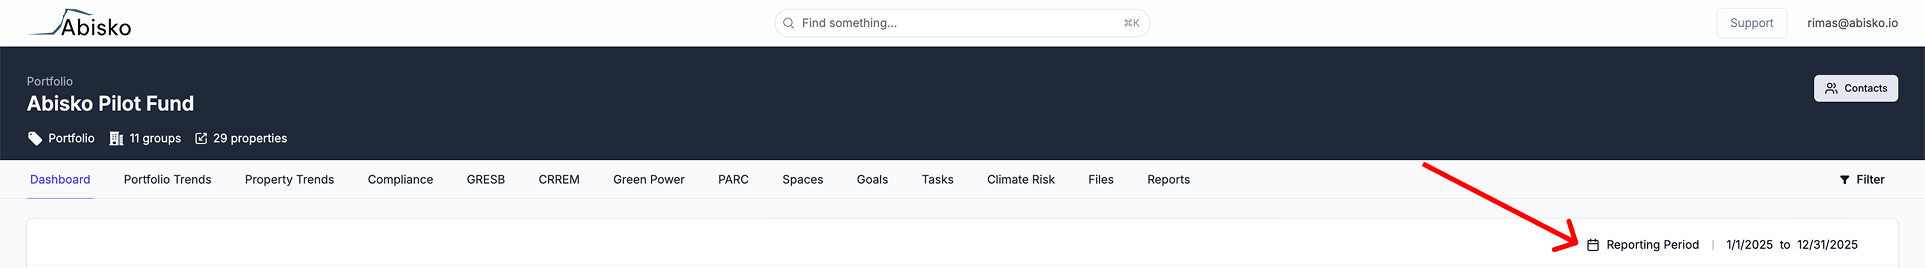
- Select the last month of the target 12-month period over which you want data to be displayed
- e.g. To view data for 2024 (Calendar Year) select December 2024
- This will set the reporting period to 1/1/2024 → 12/31/2024
- e.g. To view data for 12-months ending in Q2 2025 select June 2025
- This will set the reporting period to 7/1/2024 → 6/30/2025
- e.g. To view data for 2024 (Calendar Year) select December 2024
Setting the Base Period
The base period can be set from tabs that include performance metrics that span multiple years.Tabs with Base & Reporting Periods - Click to Expand
Tabs with Base & Reporting Periods - Click to Expand
Portfolio Level
- Portfolio Trends
- Property Trends
- Spaces
- Dashboard
- Annual Trends
- Spaces
- Meters
- Meter Exploration
- Click on the Base Period button at the top of any relevant tab (below the tab names)
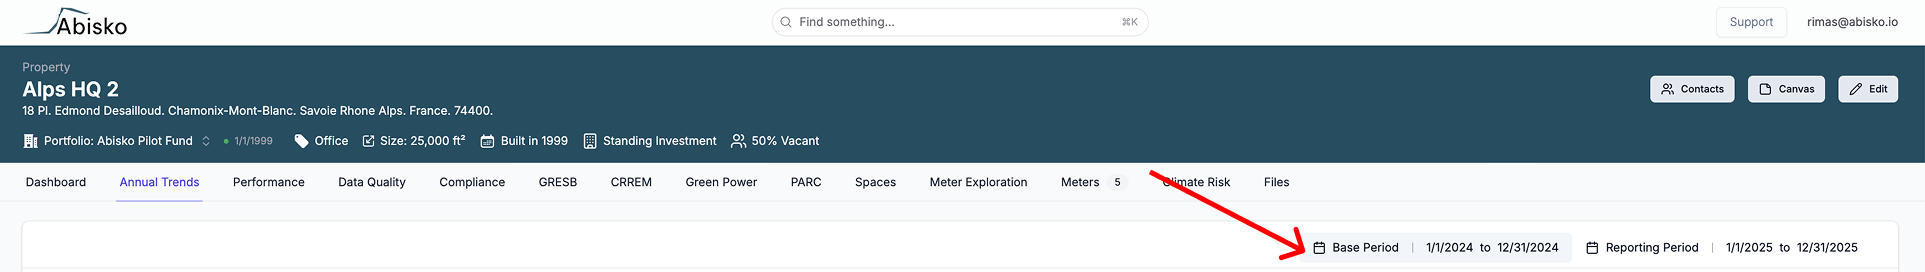
- Select the last month of the target 12-month base period
The base period will default to the 12-month period preceding the originally selected reporting period. To select a different period that is non-contiguous, simply select and independently set the base period.
- e.g. To view data for 2023 (Calendar Year) select December 2023
- This will set the reporting period to 1/1/2023 → 12/31/2023
- e.g. To view data for 12-months ending in Q2 2024 select June 2024
- This will set the reporting period to 7/1/2023 → 6/30/2024
- e.g. To view data for 2023 (Calendar Year) select December 2023
Trends across Periods
Once set, base and reporting periods persist throughout the user’s session, even as they navigate between tabs, properties, and portfolios. Trends between base and reporting periods will depend on the tab in which the data is displayed.Year to Year Trends
In tables that display year to year trends, the base and reporting periods will be be clearly displayed in table columns. e.g. Portfolio - Property Trends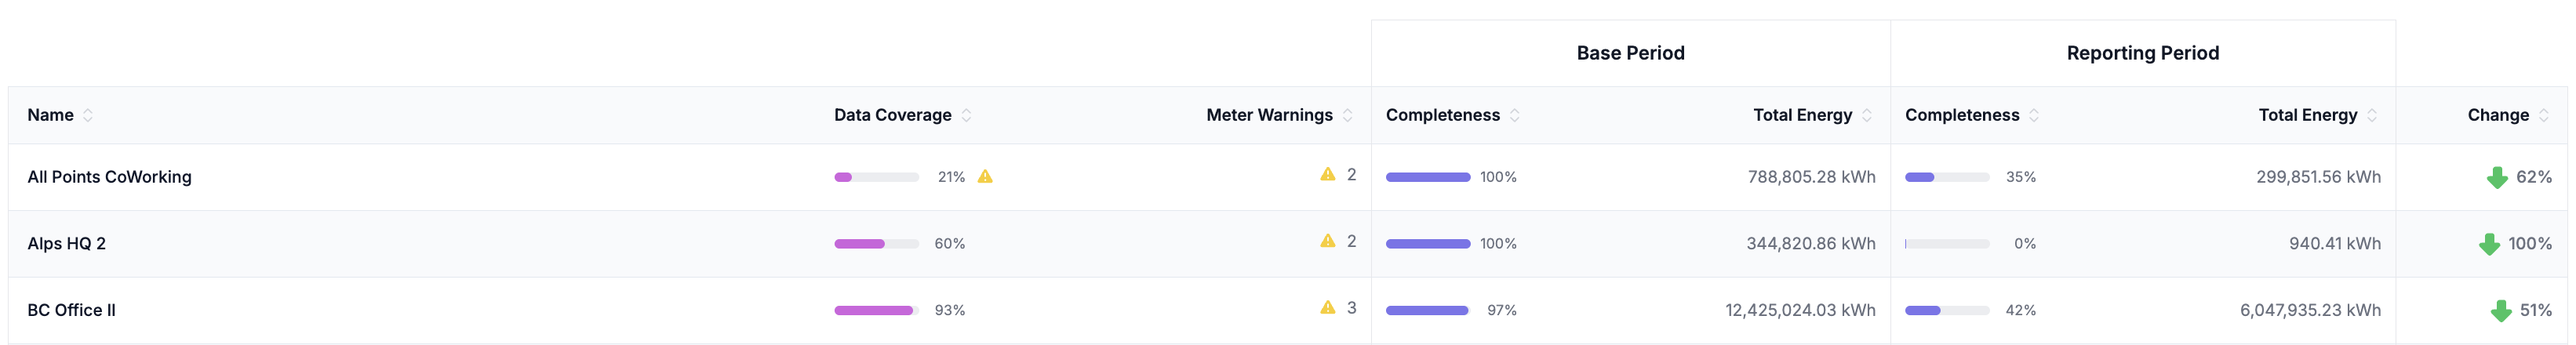
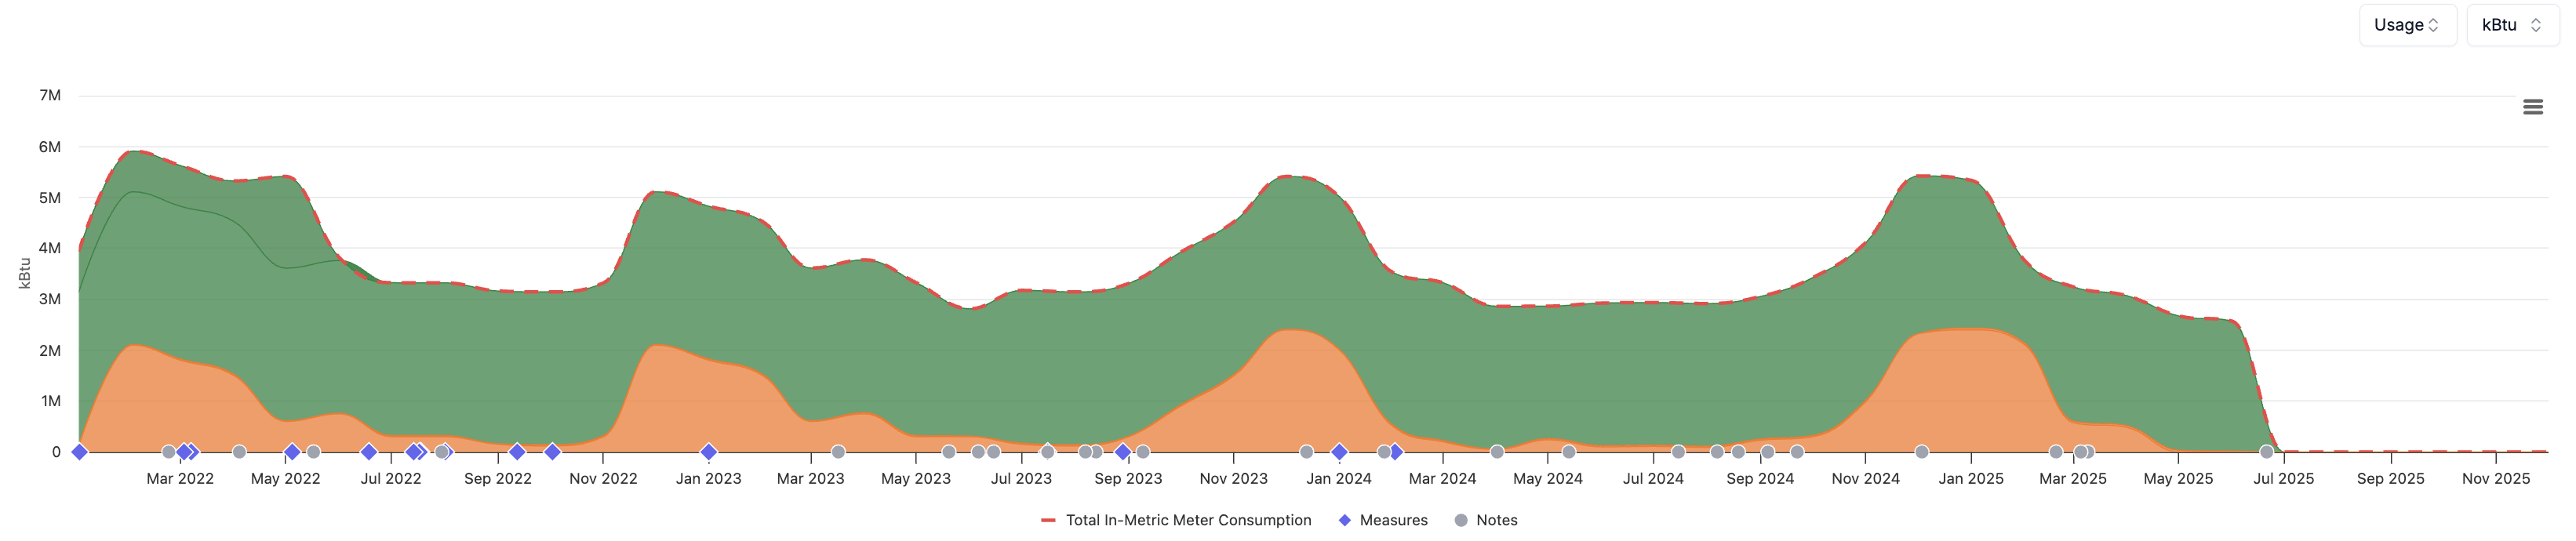
Monthly Trends
In plots that display monthly trends, data will be shown from the first month of the base period to the last month of the reporting period, even if this overall period spans multiple years. e.g. Property - Meter Exploration