GRESB Partnership
In 2024, GRESB selected Abisko as its partner to develop a new toolkit designed to enhance the accuracy and efficiency of GRESB reporting via ENERGY STAR Portfolio Manager®. Launched in 2025, the GRESB Toolkit has transformed reporting for GRESB members and partners by streamlining workflows, reducing costs, and delivering greater data accuracy.Review Process
Abisko worked directly with GRESB staff to review all methodologies, algorithms, and assumptions driving performance, gap-filling, green power, emissions, and data availability calculations. This process ensures that the platform provides the accurate GRESB submissions that fully align with official reporting guidelines. Click here to learn more about the GRESB partnership.GRESB Workflows
Abisko simplifies GRESB reporting via intuitive dashboards that help users track reporting readiness, understand data quality and performance trends, identify opportunities to improve scores and prepare submission-ready Asset Level Spreadsheets. Integrated workflows enable users to:- Track the collection of property characteristics required for GRESB
- Set reporting levels and define landlord and tenant spaces
- Assign meters to spaces and resolve data quality & completeness issues
- Report performance and validate data coverages across spaces and utilities
- Manage measures, assessments and certifications across portfolios
Property Level
Navigate to Property → GRESB Users can track reporting readiness for a property by using the reporting progress panel located on the left-hand side of the GRESB tab. The panel is displayed by default but can be hidden by clicking the small left arrow in the top-right corner. Within the panel, users can quickly see which GRESB subtabs for the property still need to be reviewed. Users can also click on the name of any section in the panel to quickly jump to the corresponding GRESB subtab.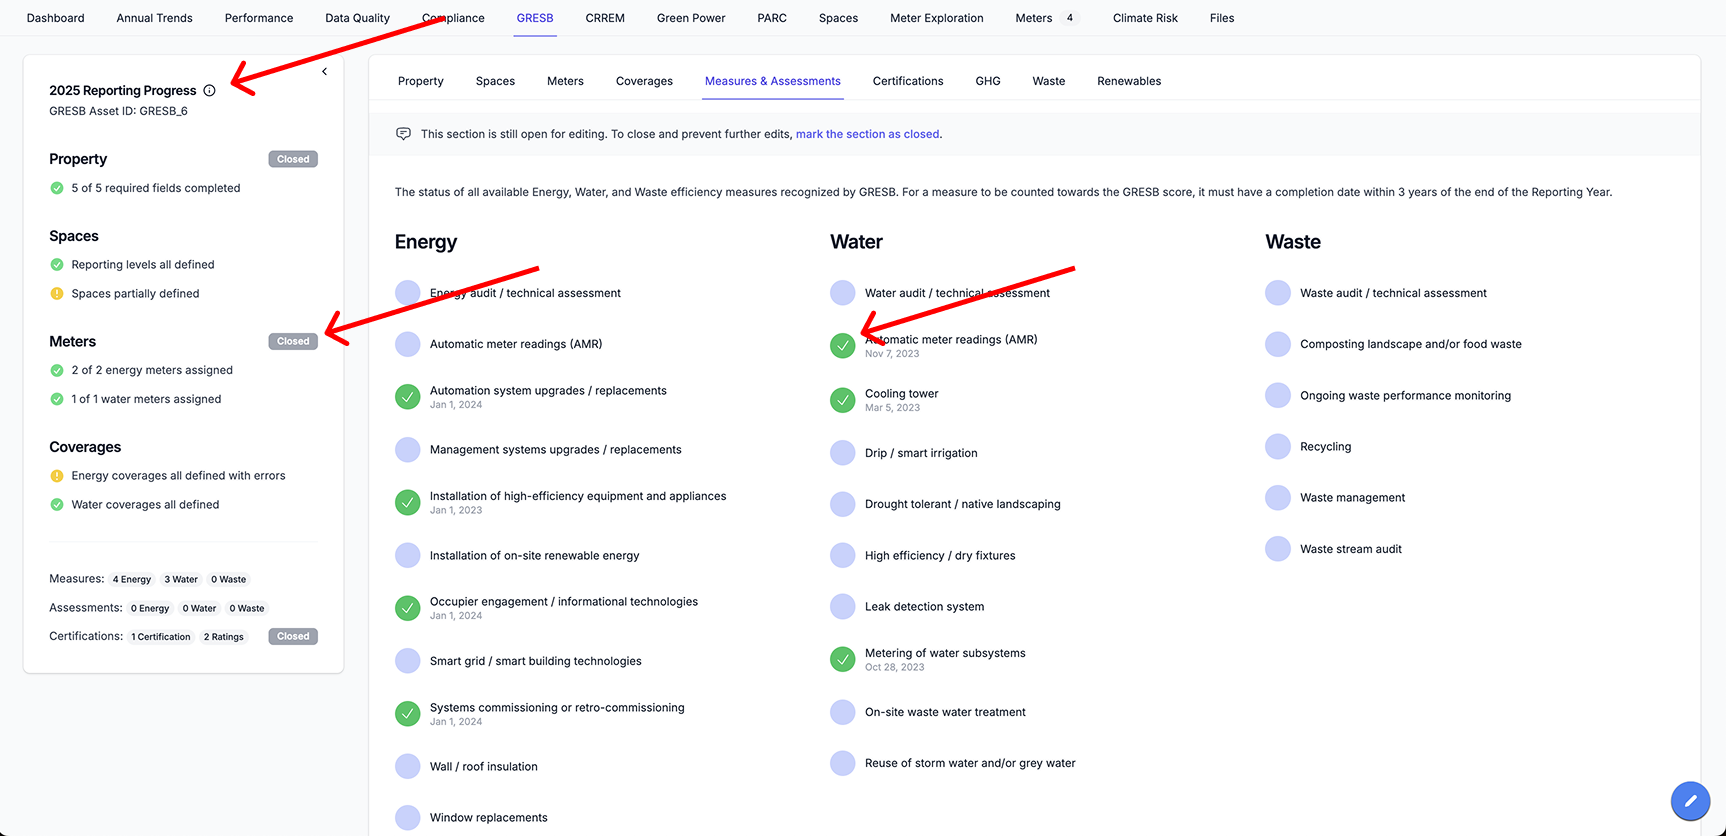
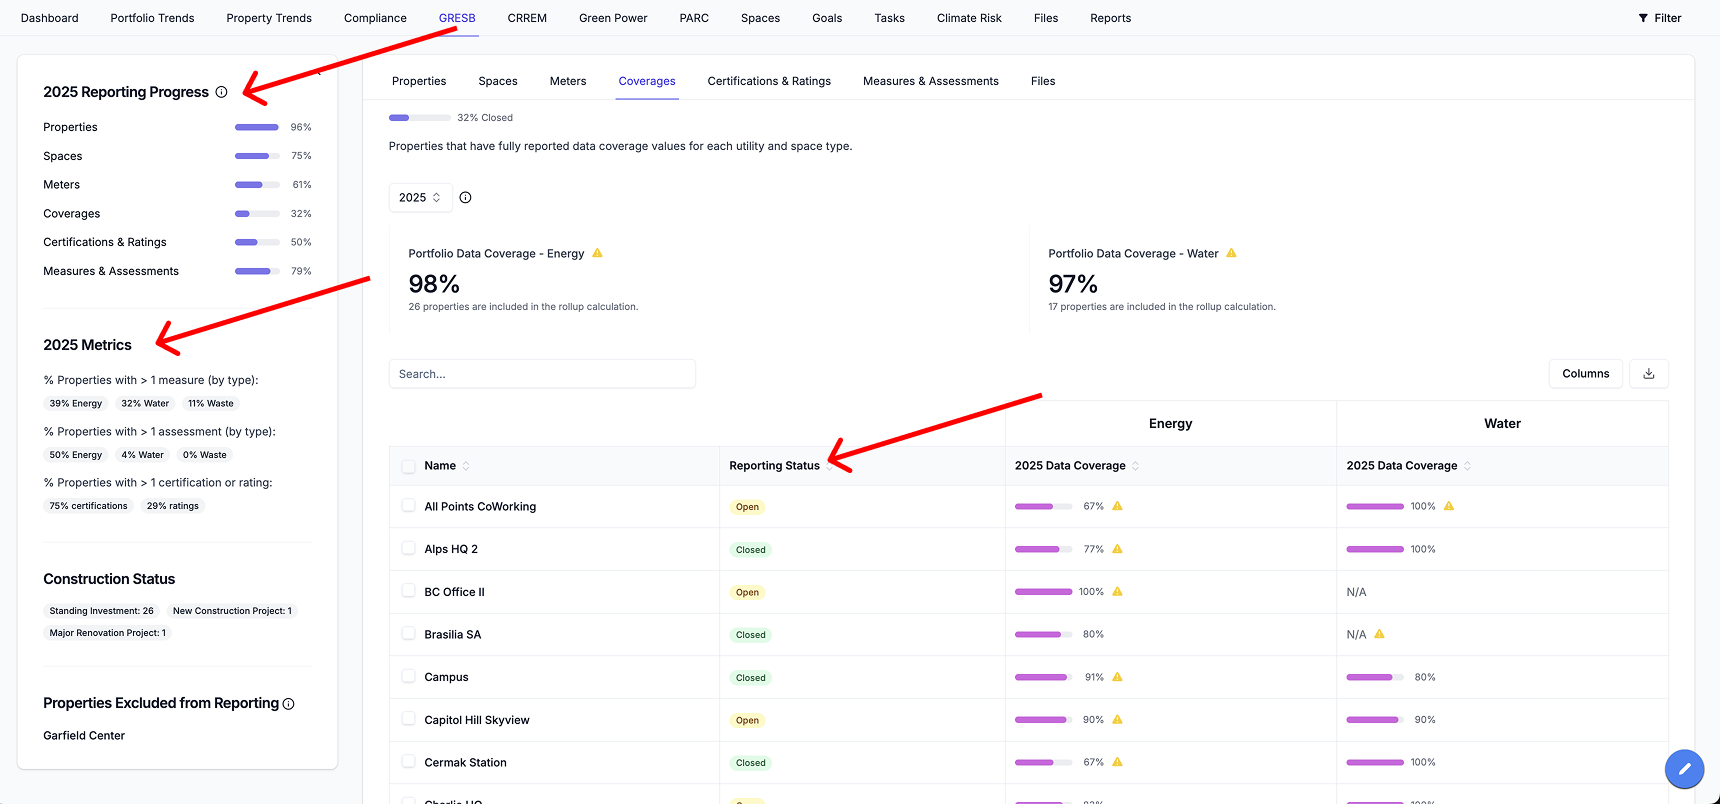
Portfolio Level
Navigate to Portfolio → GRESB Users can also track reporting readiness at the portfolio level using the reporting progress panel. Each progress bar represents the percentage of properties in the portfolio for which the corresponding GRESB subtab has been marked as Closed. For example, if the Spaces bar shows 75% complete, this indicates that users have entered data for the Spaces subtab and manually marked it as Closed, for 75% of properties in the portfolio. This progress panel enables users to quickly identify which properties have been reviewed and finalized, and which still require attention during the GRESB reporting season.