EXCEL Reports
Portfolio Performance & Data Quality Report
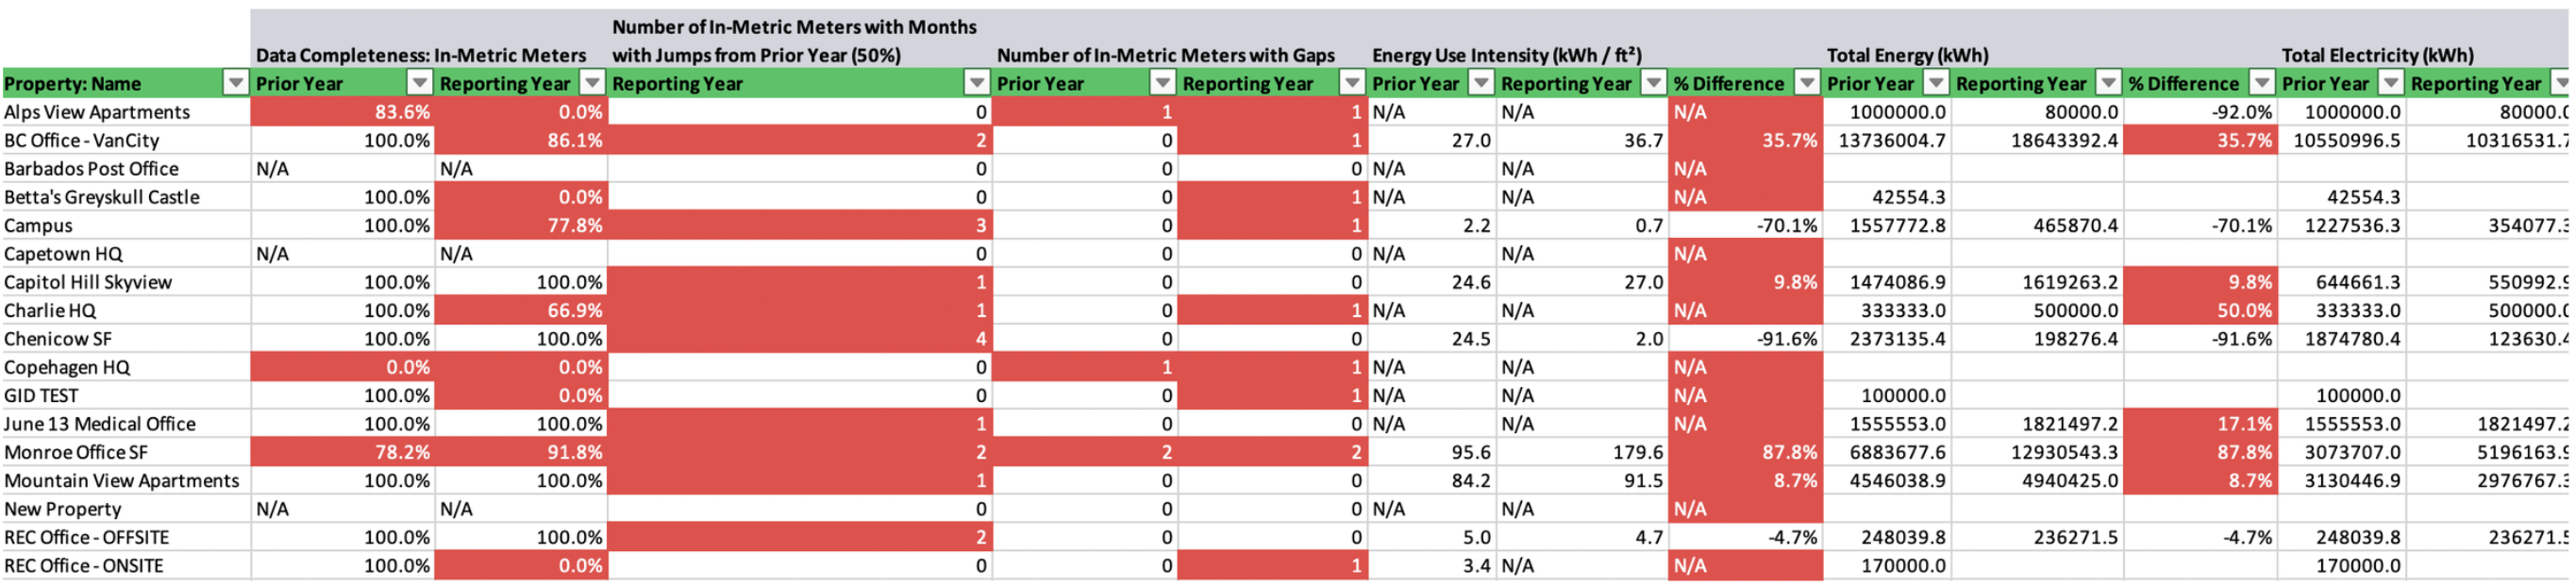
Navigate to Portfolio → Reports → Performance A comprehensive excel report that includes annual and monthly consumption trends and data quality metrics across the portfolio, properties, and in-metric meters. Property-level The property level tabs in the EXCEL report include the following data quality insights:Data Quality Metrics
Data Quality Metrics
- Whole Building (in-metric) Data Completeness
- Number of In-Metric Meters with Months with Jumps from Prior Year (50%)
- Number of In-Metric Meters with Gaps
- Number of In-Metric Meters with Overlaps
Whole Building Consumption Metrics & Annual Percent Changes
Whole Building Consumption Metrics & Annual Percent Changes
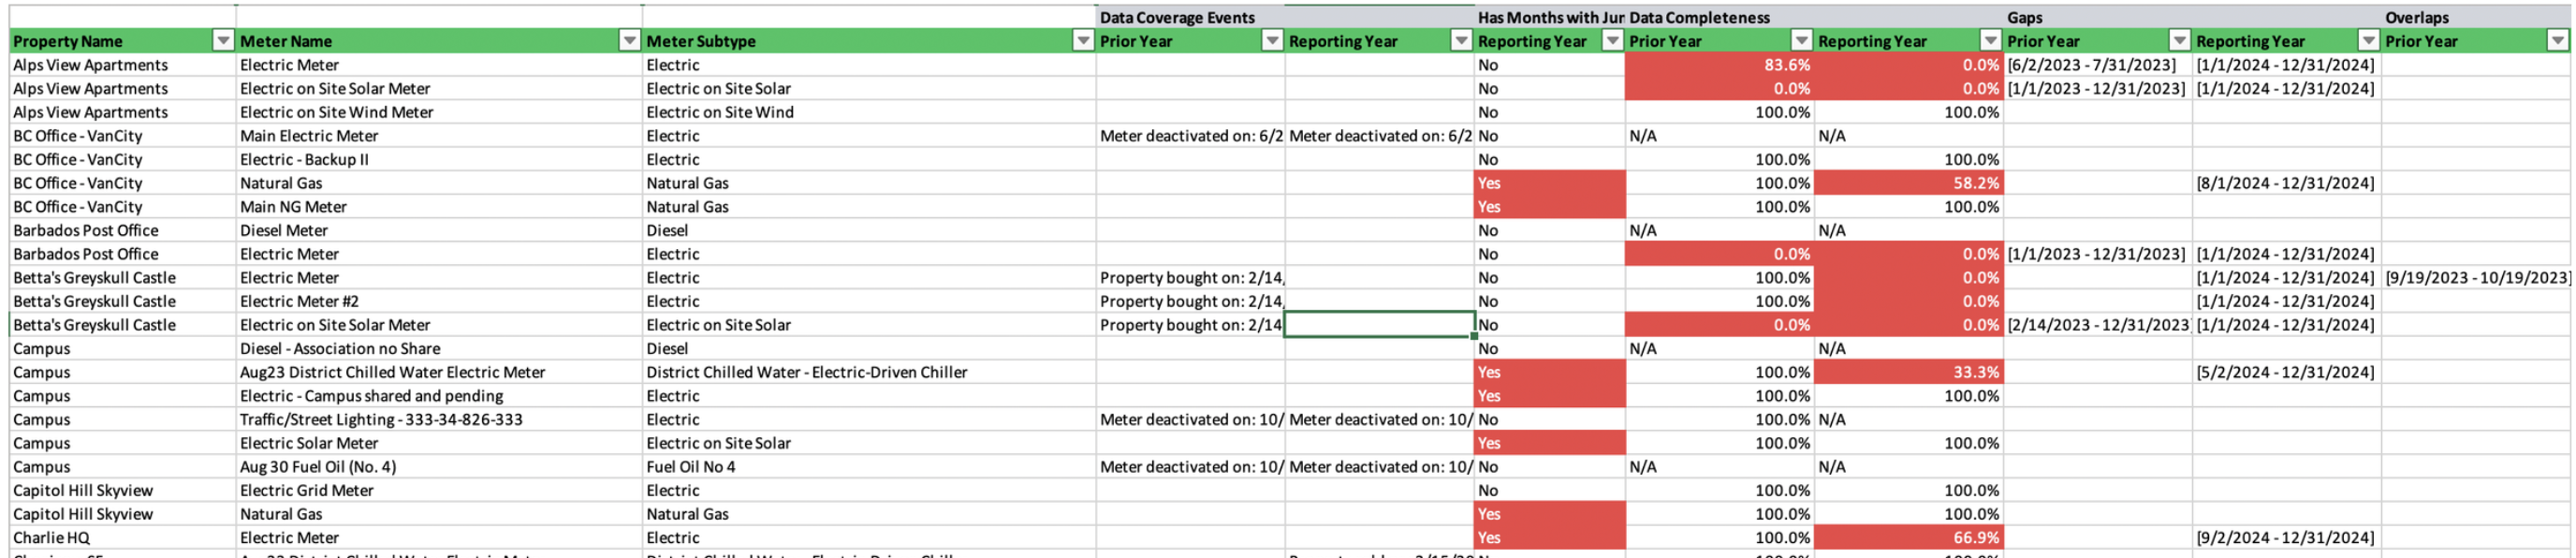
Meter Gaps, Overlaps, Jumps, Consumption, Annual Percent Changes
Meter Gaps, Overlaps, Jumps, Consumption, Annual Percent Changes
- Data Coverage Events
- Data Completeness
- Specific Monthly Jumps from Prior Year
- Specific Gaps
- Specific Overlaps
- Total Energy & percent changes
- Total Emissions & percent changes
Landlord vs. Tenant Performance Report
Navigate to Portfolio → Reports → Performance A comprehensive excel report that includes annual and monthly consumption trends and data quality metrics across the portfolio, property spaces types (e.g. landlord vs. tenant) and all in-metric and out-of-metric meters. Property-level The property level tabs in the EXCEL report include the following data quality insights:Data Quality Metrics
Data Quality Metrics
- Data Completeness (%): All Meters with Assigned Spaces
- Number of Assigned Meters with Months with Jumps from Prior Year (50%)
- Number of Assigned Meters with Gaps
- Number of Assigned Meters with Overlaps
Space-based Consumption Metrics & Annual Percent Changes
Space-based Consumption Metrics & Annual Percent Changes
- Total Energy - (Assigned) Base Building (Common Areas)
- Total Energy - (Assigned) Base Building (Shared Services)
- Total Energy - (Assigned) Tenant Spaces (Landlord Controlled)
- Total Energy - (Assigned) Tenant Spaces (Tenant Controlled)
- Total Energy - (Assigned) Outdoor / Exterior Areas / Parking Landlord Controlled
- Total Energy - (Assigned) Outdoor / Exterior Areas / Parking Tenant Controlled
- Total Energy - (Assigned) EV Charging
Meter Gaps, Overlaps, Jumps, Consumption, Annual Percent Changes
Meter Gaps, Overlaps, Jumps, Consumption, Annual Percent Changes
- Data Coverage Events
- Monthly Jumps from Prior Year
- Data Completeness (%)
- Specific Gaps
- Specific Overlaps
- Total Energy
- Green Power - Total Onsite
- Total Location-based Emissions
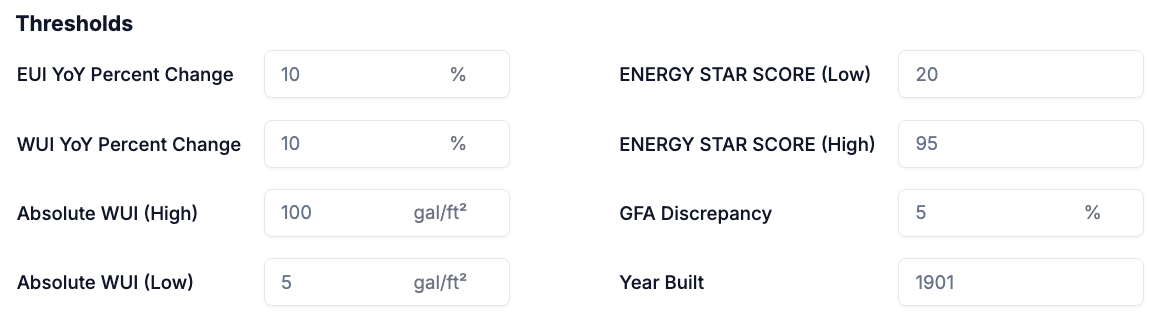
ENERGY STAR Portfolio Manager® Gaps & Flags Report
Navigate to Portfolio → Reports → ESPM A comprehensive excel report that identifies potentially anomalous (e.g. high or low) property attributes, property performance metrics, meter configurations, and meter entries across the portfolio. Threshold parameters, which are used to detect potential anomalies, can be set by the user prior to report generation.