About the Report
- Reporting Period: Monthly and annual performance trends and consumption values are provided for each meter, property, and portfolio for the selected reporting period, as well as for the preceding 12 months.
- Properties: This report includes all properties associated with the portfolio that were owned at any time during the selected 12-month reporting period. Metrics are reported only for periods that fall within each property’s ownership period.
- Meters: All energy metrics are driven by consumption from all meters assigned to a space type, regardlesss of Energy Reporting Level or in-metric status.
Metrics & Trends
The following performance metrics are included in this report for the portfolio and all properties, with consumption and emissions values additionally provided for meters.EXCEL Tabs
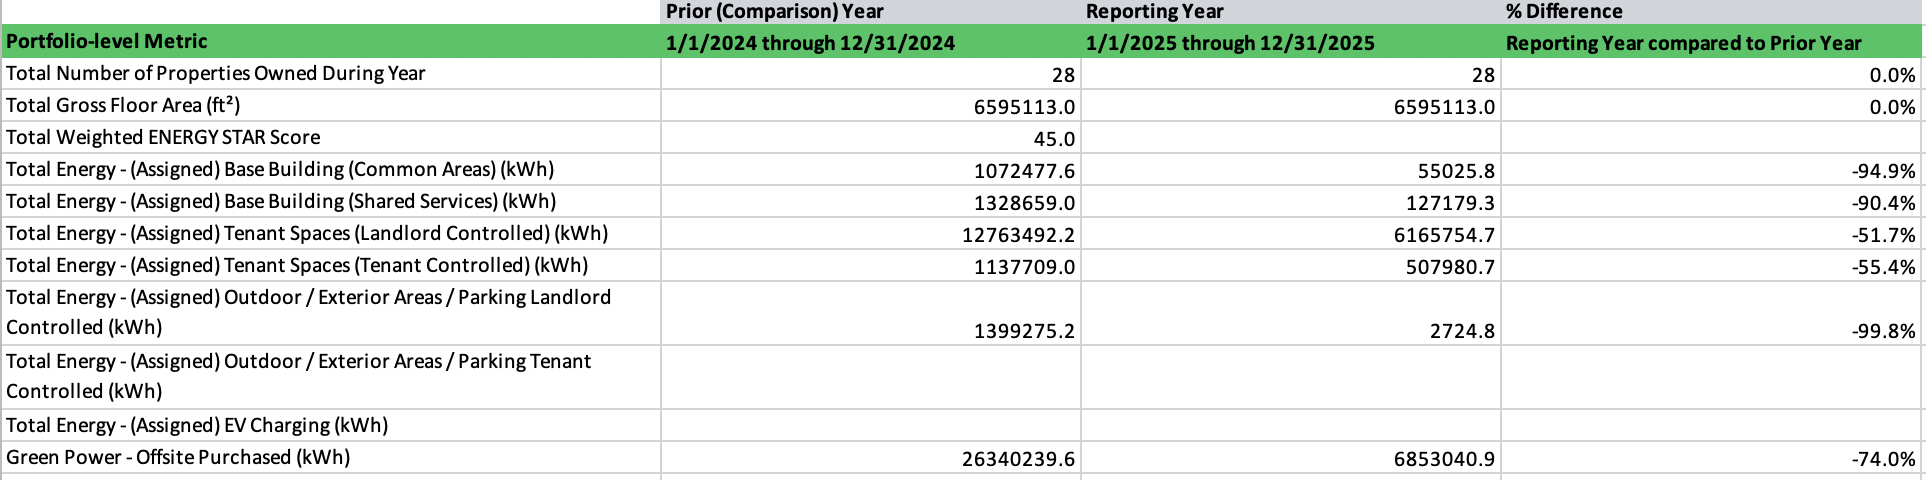
The report is organized into multiple tabs that include monthly and annual trends across meters and properties, along with a portfolio-level summary.Portfolio Trends (Annual)
The Portfolio Trends (Annual) tab summarizes energy trends across the entire portfolio. What you’ll find:- Annual energy use metrics for each building and exterior space type.
Property Trends (Annual)
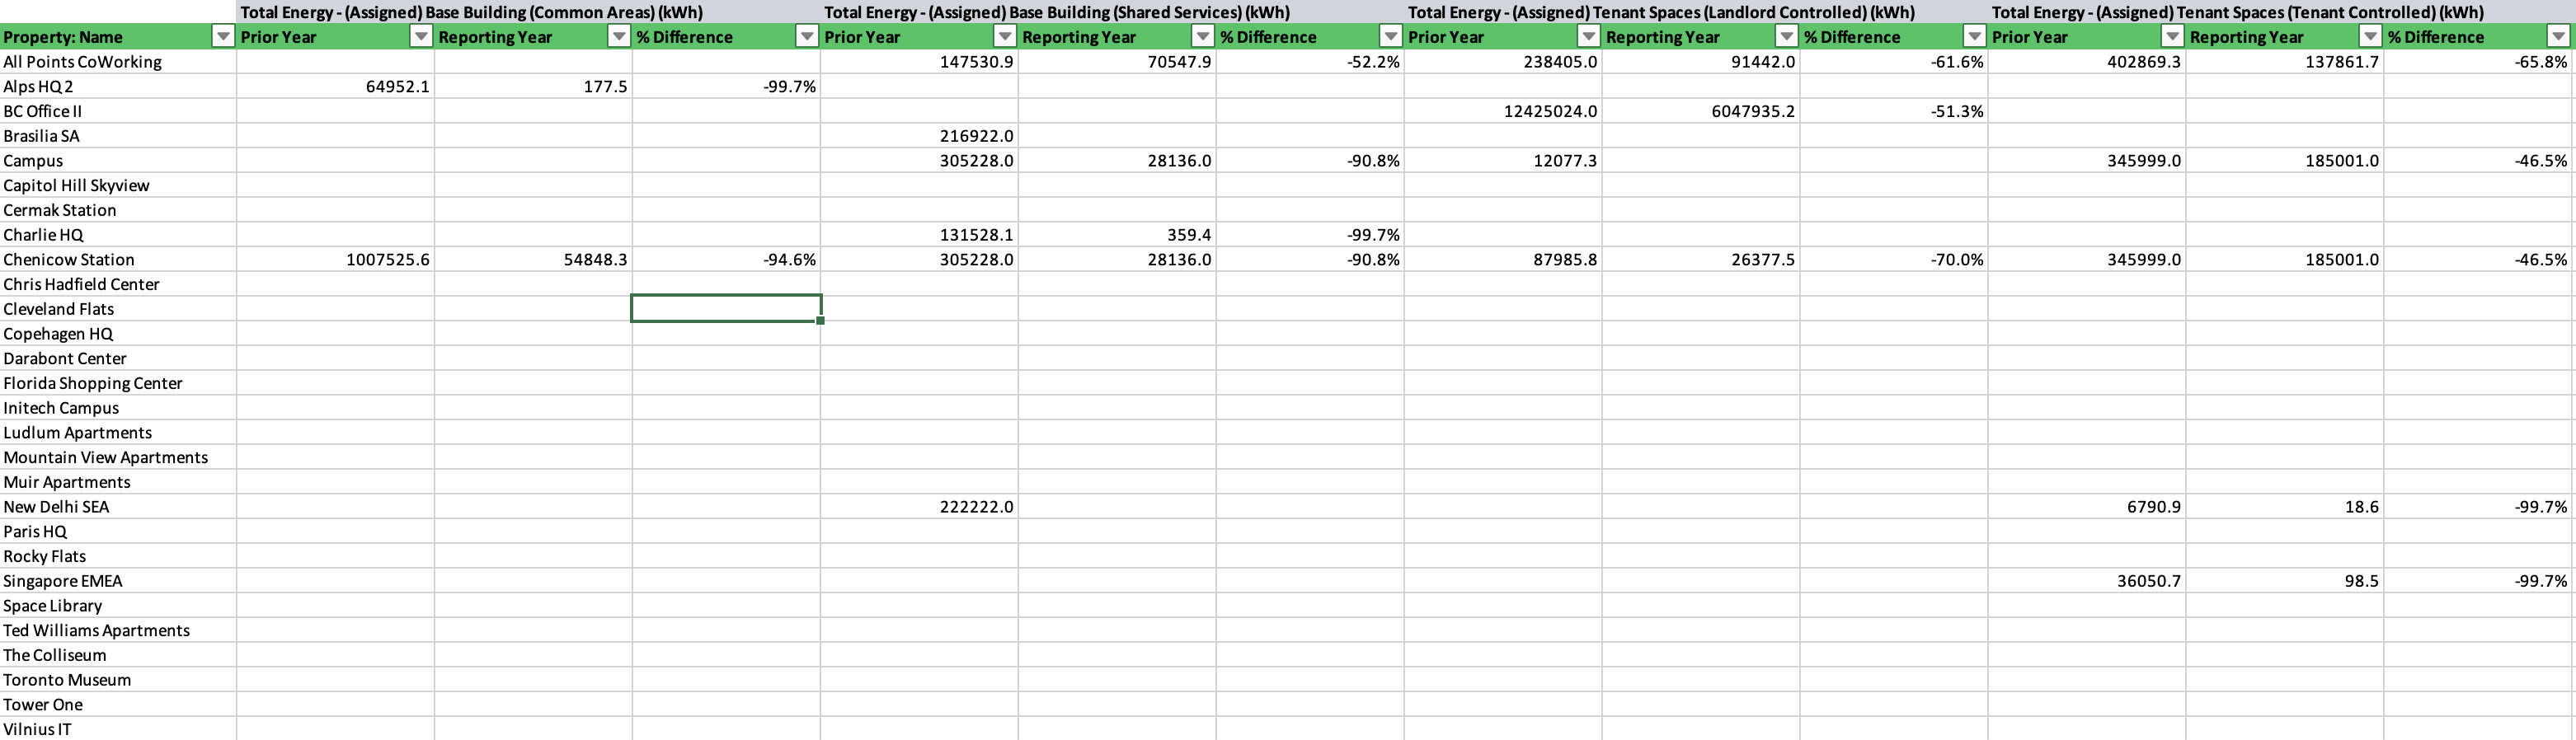
The Property Trends (Annual) tab shows annual energy use and data quality trends for each space type within each property in the portfolio. What you’ll find:- Property-level details
- Annual energy use metrics for each building and exterior space type.
- Annual data quality metrics for each property
- Data Completeness (%)
- Number of meters with identified gaps and overlaps.
Property Trends (Monthly)
The Property Trends (Monthly) tab shows monthly energy use trends for each space type within each property in the portfolio. What you’ll find:- Property-level details
- Monthly energy use values for each building and exterior space type.
- Trends over 24 consecutive months
Meter Trends (Annual)
The Meter Trends (Annual) tab presents annual energy use and data quality metrics for every meter in every property across the portfolio. What you’ll find:- Property-level reference details
- Energy Reporting Level
- Meter-level details
- Activation periods, Meter type & subtype, Space assignment, Scope designation, etc.
- Year-over-year emissions trends for each meter
- Year-over-year Onsite Green Power trends for each meter
- Annual data quality metrics for each meter
- Data Completeness (%)
- Specific Gaps over 24-month period
- Specific Overlaps over 24-month period