Exploring Meter Data
The Meter Exploration tab allows users to explore monthly and annual performance trends across any combination of meters and spaces.
- Navigate to Property → Meters → Energy / Emissions / Water / Waste
- All in-metric meters are toggled on by default to view whole building performance trends
- Toggle on/off any meter to update the meters included in the plots and tables below
Meter Exploration Monthly & Annual Trends & Unit Options
Monthly Plot
The main plot of the meter exploration tab displays monthly trends for all selected meters from the first month of the base period to the last month of the reporting period. Users can set different options to update what data is displayed and how.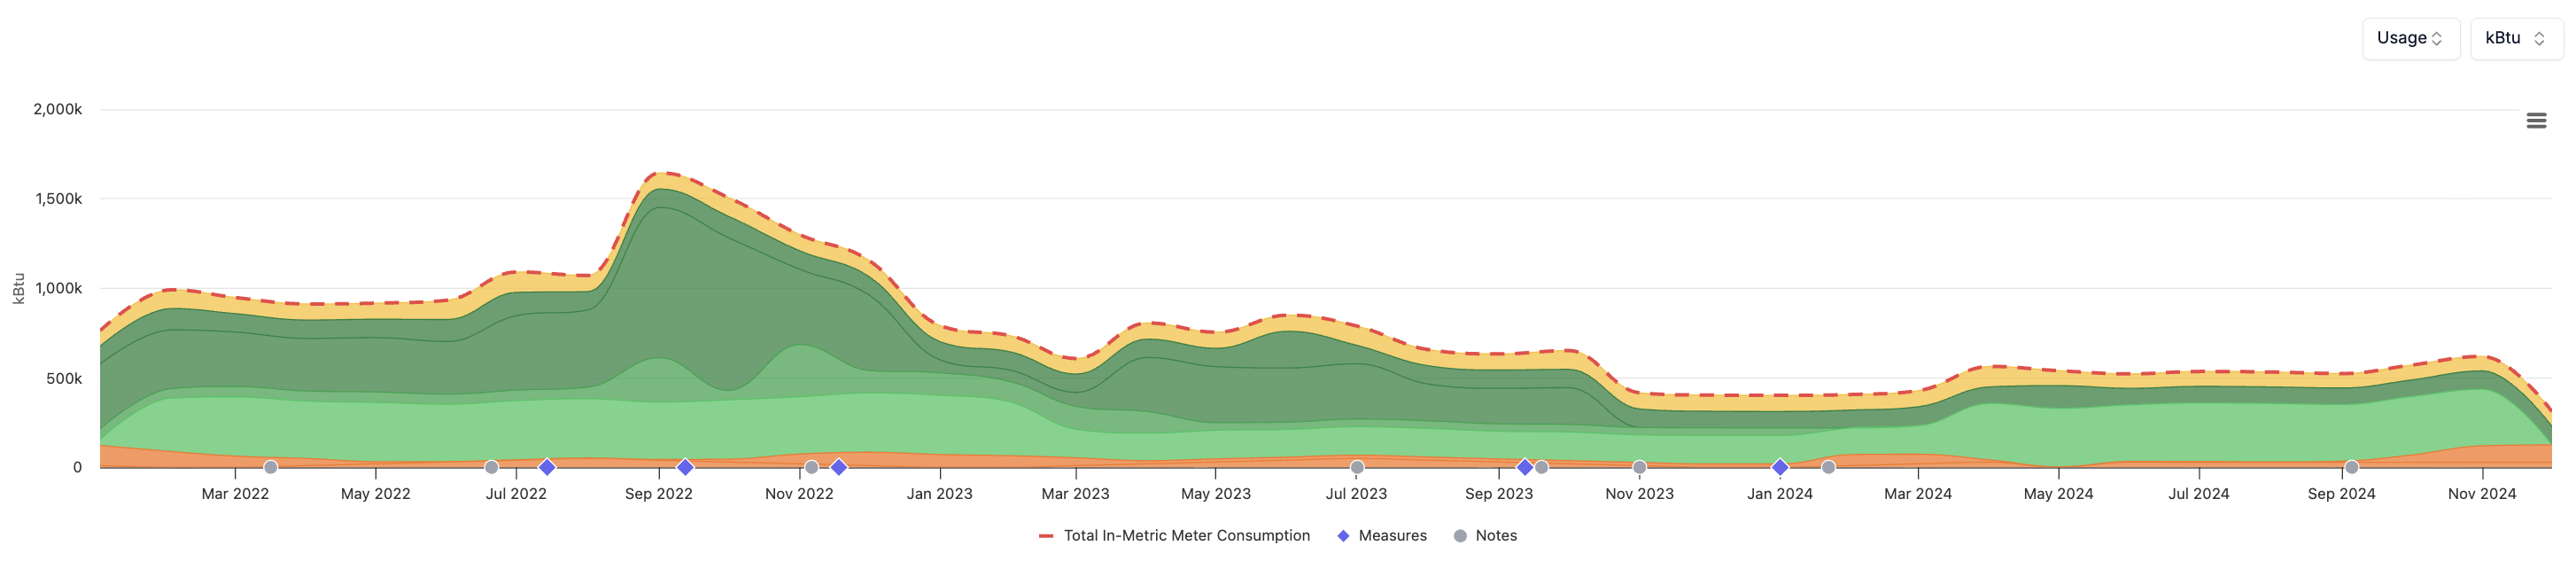
- Plot Options & CSV Download: In the top right of the monthly plot
- Dropdown: Select the desired data series to plot monthly cost or consumption totals
- Dropdown: Select the desired units in which to plot the data
- Hamburger Icon: Click to generate a CSV export with all monthly values for each meters
- Plot Legend Options
- Toggle on/off any of the additional series that are included in the plot
- Series #1: Total in-metric consumption/emissions/waste
- Series #2: All relevant measures (energy/water) completed during the selected periods
- Series #3: All property notes with dates during the selected periods
- Toggle on/off any of the additional series that are included in the plot
Annual Trends
Below the main plot, the meter exploration tab displays annual totals for each meter along with other useful information.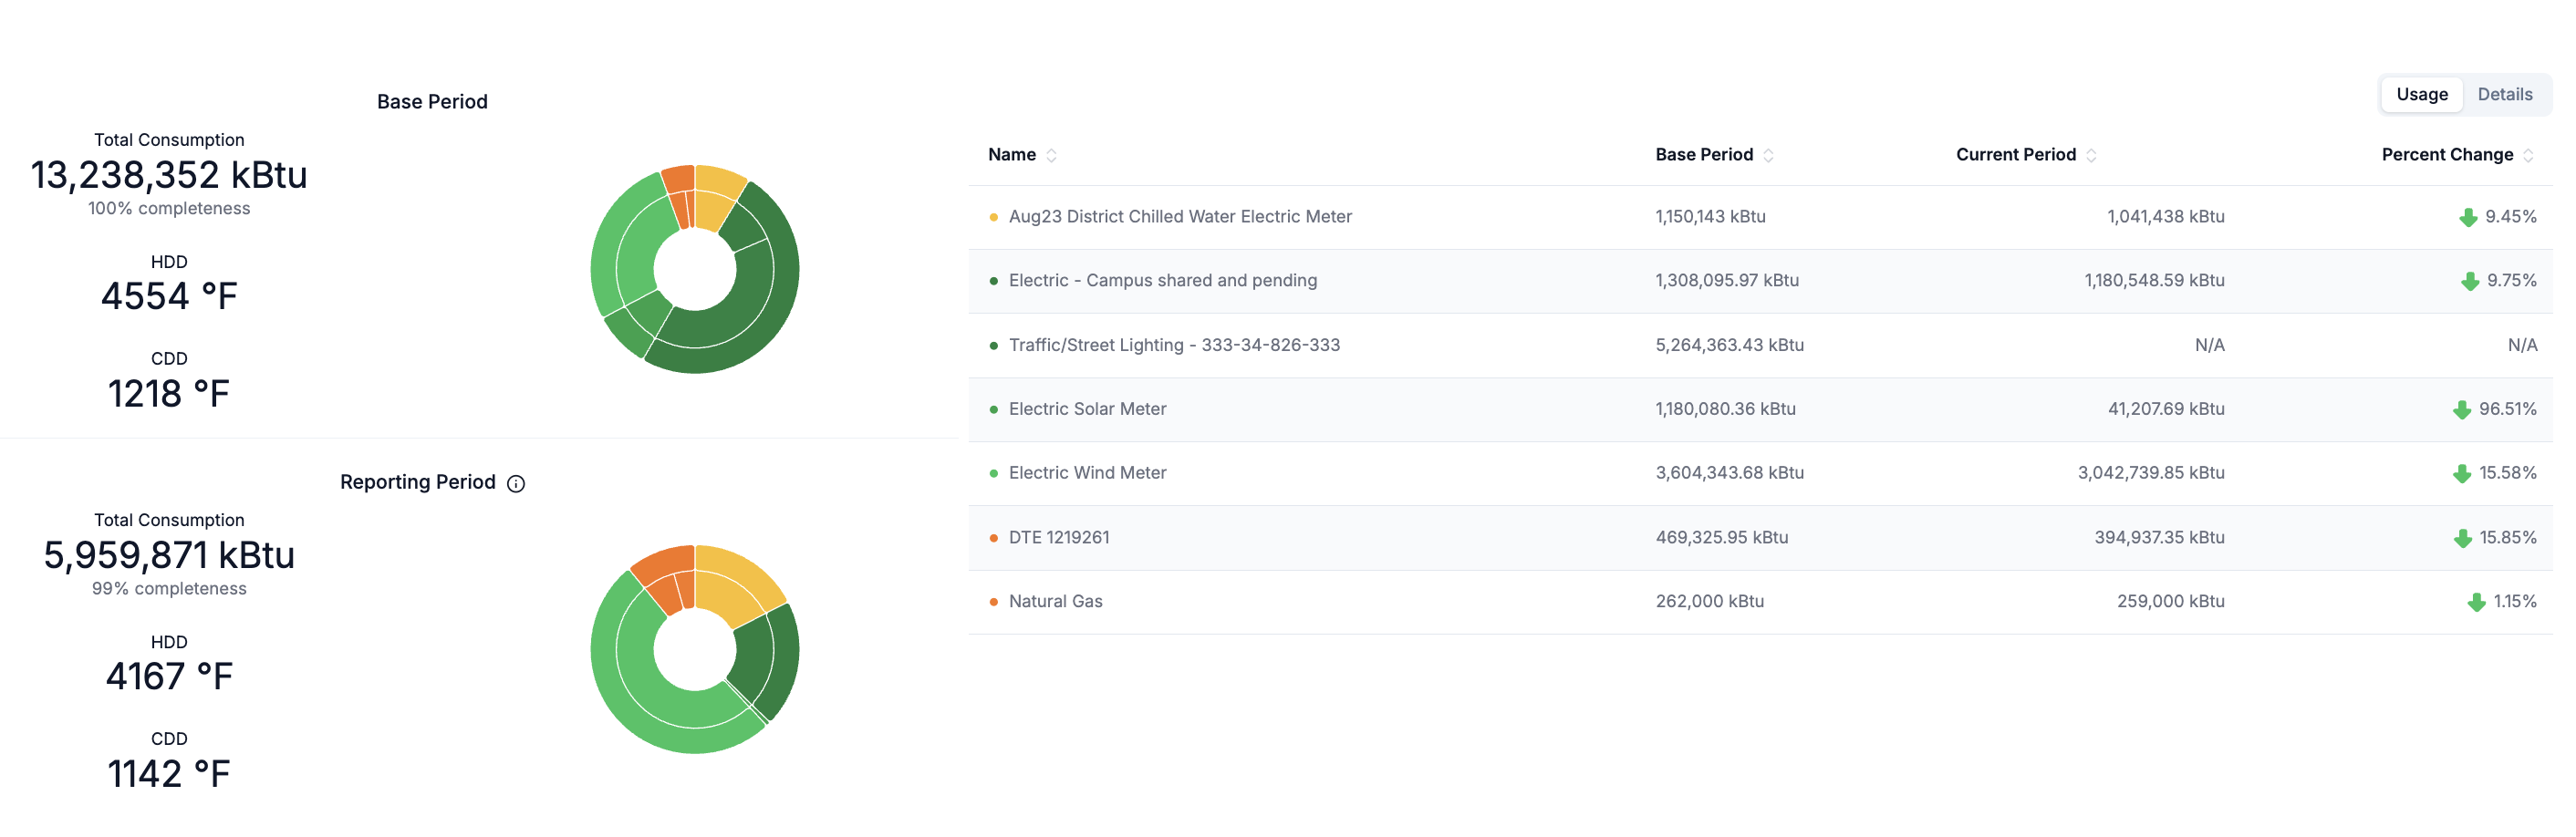
- Left Panel - Stat Cards
- The total annual consumption or cost calculated as the sum across all selected meters over the base & reporting periods.
- The total annual data completeness (%) of all selected meters over the base & reporting periods.
Annual heating degree (hdd) and cooling degree day (cdd) totals provided for energy.
- Left Panel - Donut Charts
- The relative annual totals for all selected meters.
- Hover over each section to view the details in the tooltip.
- Right Panel - Table
- The annual consumption or cost for each selected meter over the base & reporting periods.
- The annual consumption or cost percent change for each meter from the base to reporting period.
- Toggle to view individual meter details, including meter subtype, in-metric status and activation periods.