This report is based on Whole Building performance metrics, which are driven by all in-metric meters associated with each property.
- Energy & Emissions: Monthly & annual trends at the meter, property and portfolio-level.
- Broken down by energy type, location-based and market-based emissions
- Water: Monthly & annual trends at the meter, property and portfolio-level.
- Waste: Monthly & annual trends at the meter, property and portfolio-level.
- Broken down by waste and disposal types.
About the Report
- Reporting Period: Monthly and annual performance trends and consumption values are provided for each meter, property, and portfolio for the selected reporting period, as well as for the preceding 12 months.
- Properties: This report includes all properties associated with the portfolio that were owned at any time during the selected 12-month reporting period.
- Meters: This report includes whole building performance and data quality metrics driven by all in-metric meters associated with the included properties.
Performance Metrics & Trends
The following performance metrics are included in this report, along with supporting metrics (e.g., green power), at the meter, property, and portfolio levels where applicable.EXCEL Tabs
The report is organized into multiple tabs that include monthly and annual trends across meters and properties, along with a portfolio-level summary.Portfolio Trends (Annual)
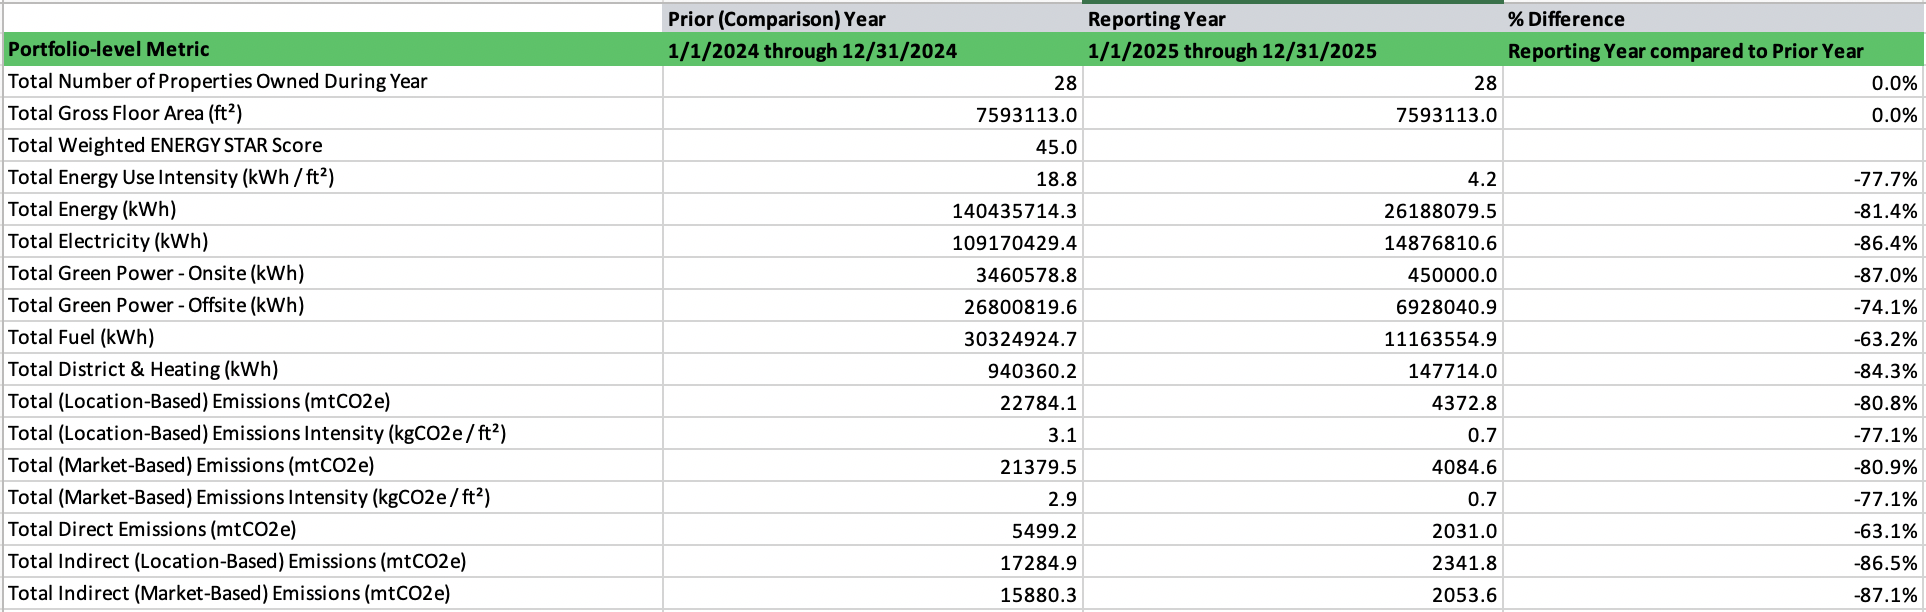
The Portfolio Trends (Annual) tab summarizes performance across the entire portfolio on an annual basis. What you’ll find:- Portfolio-level consumption aggregations
- Year-over-year performance trends broken down by energy, water and waste type
- Summary of properties with data quality issues.
Property Trends (Annual)
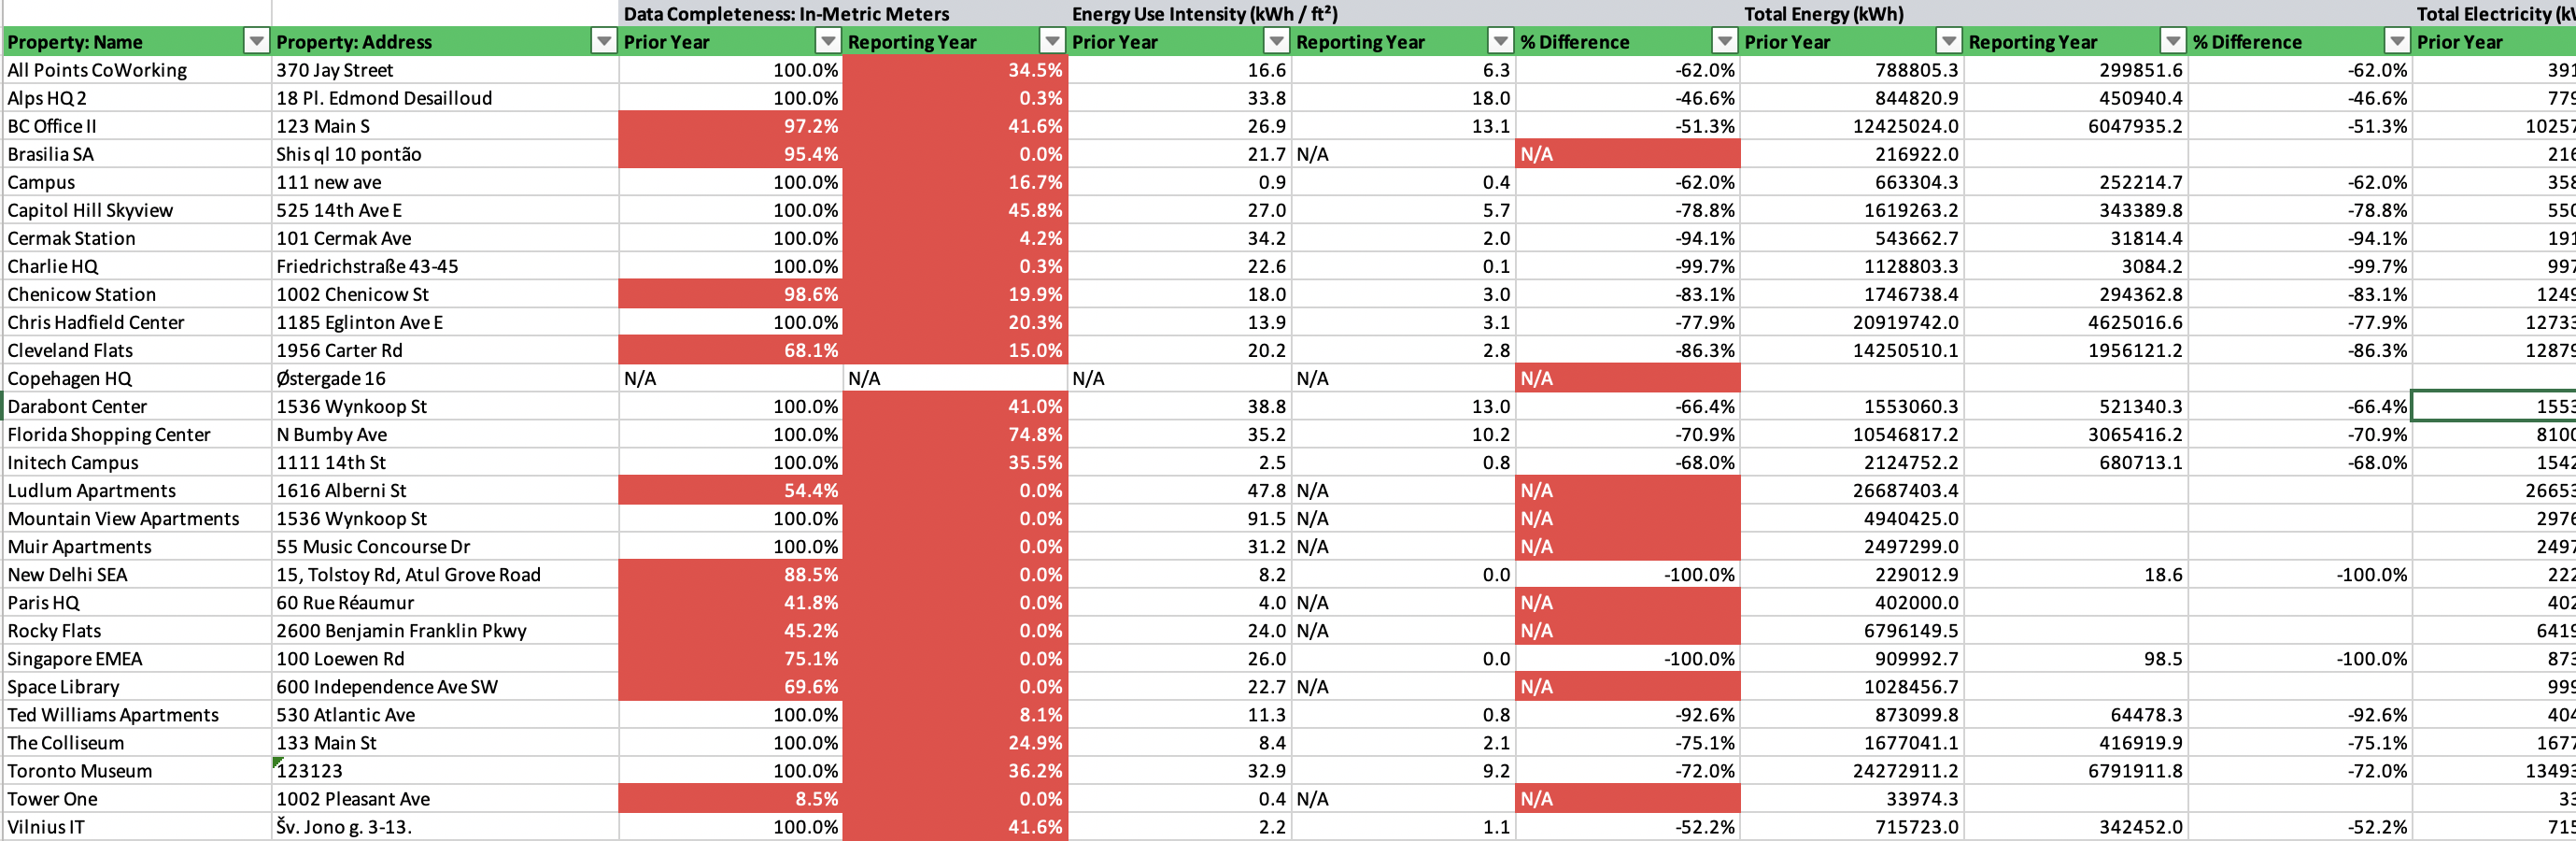
The Property Trends (Annual) tab shows annual performance and data quality metrics for each property in the portfolio. What you’ll find:- Property-level details
- Year-over-year performance trends broken down by energy, water and waste type
- Annual data quality metrics for each property
- Data Completeness (%)
- Number of meters with gaps
- Number of meters with overlaps
Property Trends (Monthly)
The Property Trends (Monthly) tab provides month-by-month performance data for each property. What you’ll find:- Property-level details
- Month-over-month performance trends broken down by energy, water and waste type
- Trends over 24 consecutive months
Meter Trends (Annual)
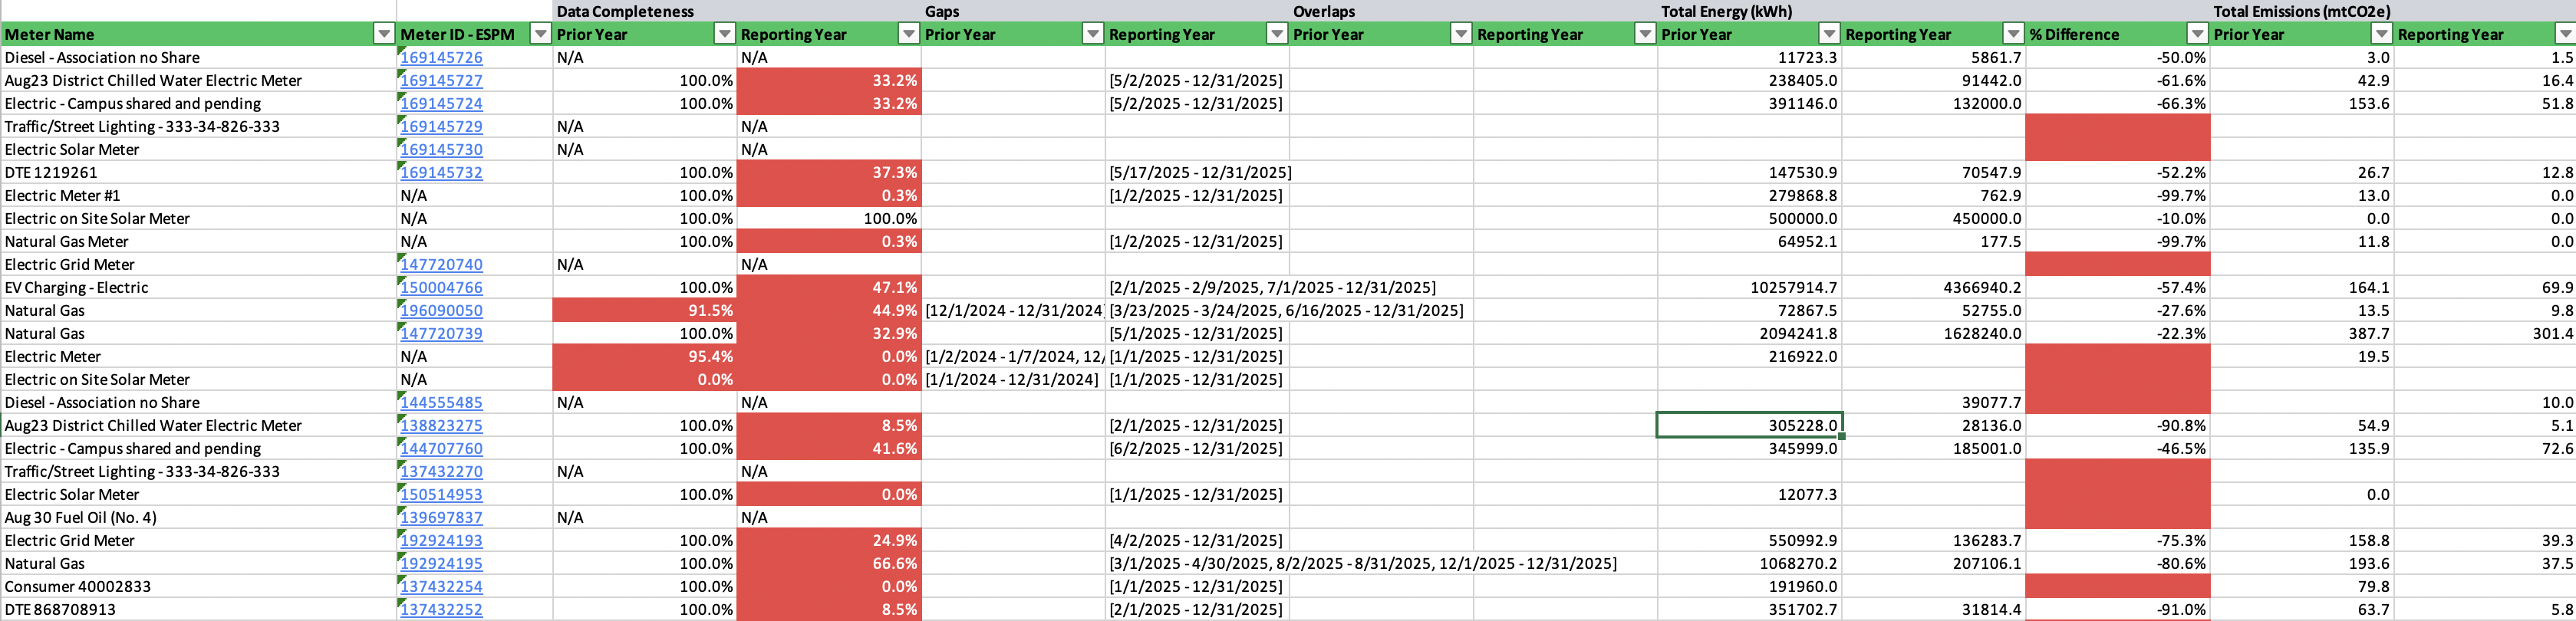
The Meter Trends (Annual) tab presents annual performance data at the individual meter level. What you’ll find:-
Meter-level details
- Activation periods, Date last updated, Meter type/subtype, Space assignment, etc.
- Year-over-year consumption trends for each meter
-
Annual data quality metrics for each meter
- Data Completeness (%)
- Specific Gaps over 24-month period
- Specific Overlaps over 24-month period
Meter Trends (Monthly)
The Meter Trends (Monthly) tab shows detailed monthly data for individual meters. What you’ll find:- Meter-level details
- Activation periods, Date last updated, Meter type/subtype, Space assignment, etc.
- Month-over-month consumption trends for each meter
- Monthly data quality metrics for each meter
- Months with Jumps from Previous Year
- Data coverage events