

Property Level
Navigate to Property → Meters1
Set Reporting Period
- Immediately set the reporting period to specify the 12-month period over which you would like to assess data quality and performance. The data request email will be automatically drafted based on gaps and overlaps identified over the selected reporting period.
2
Ensure that property contacts are up-to-date
Property contacts can be bulk imported.
- Click on the Contacts button on the right-side of the property banner

- Review all contacts
- Users with access to Abisko have a star next to their name.
- To add a new contact, click Add Contact and fill out all required details
- To edit a contact, hover over the row and click the Edit icon on the right
3
Open Data Request Panel
Click on the Data Request button in the header section to open the panel.\
4
Review the Data Requst History
Scroll down to the bottom of the panel to view a list of previously sent data requests. 
5
Configure the Email
- Select the Contact(s) in the first dropdown to whom the email will be sent. Primary Contacts are pre-selected when sending data request emails
- Select the Meter(s) to include in the email using the dropdown menus
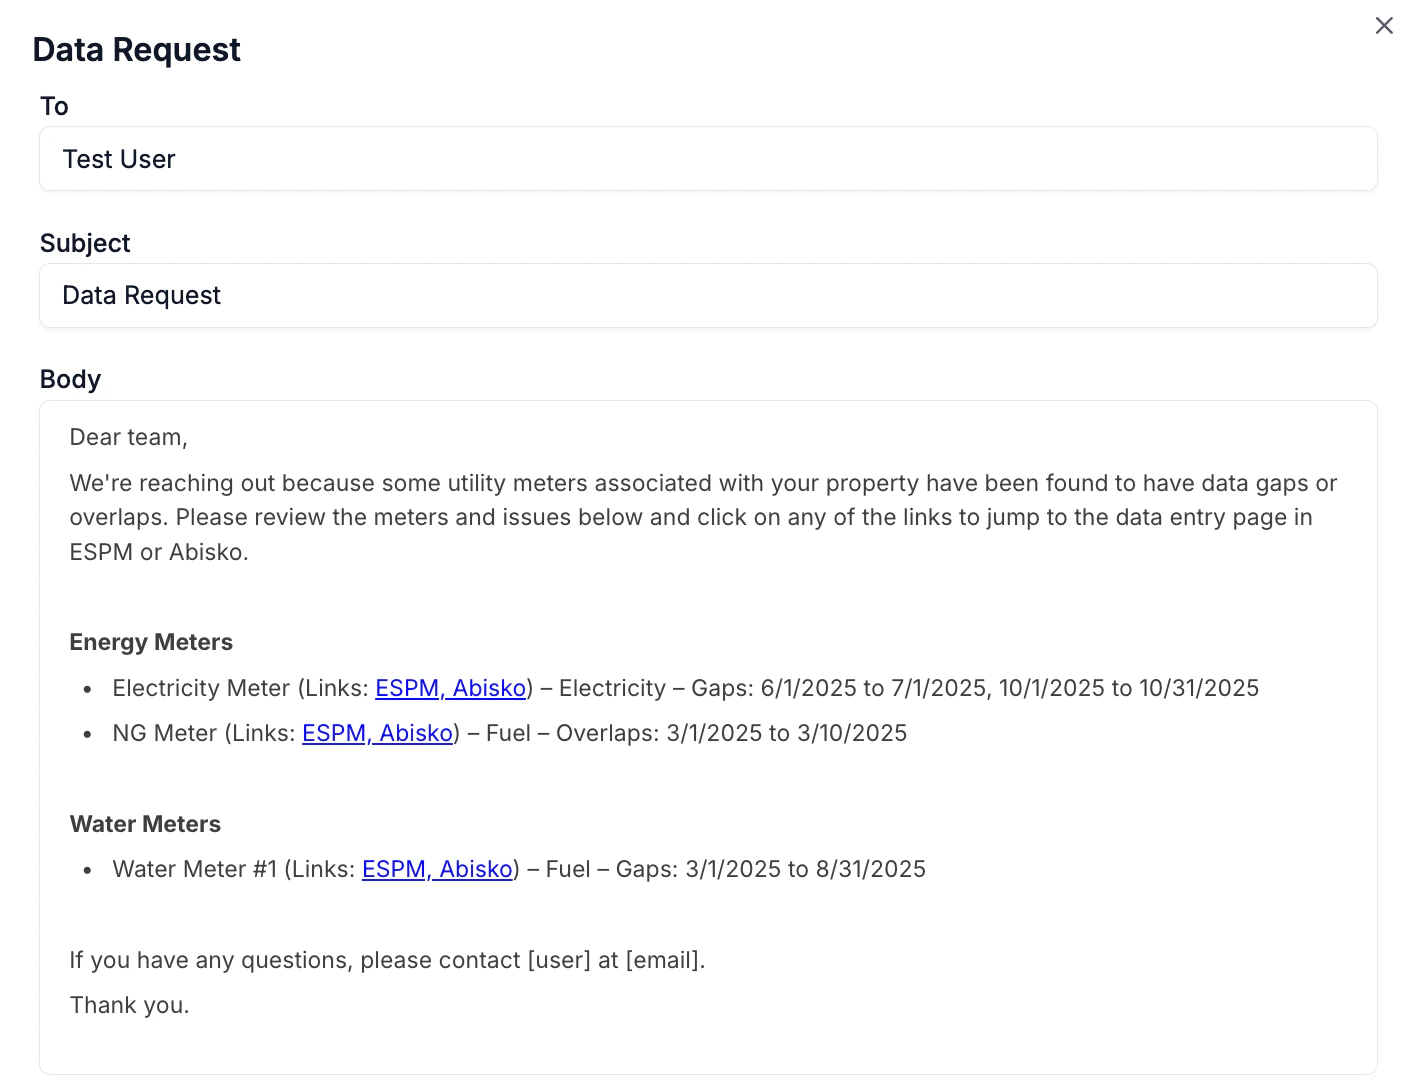
- Edit the email Subject and Body
The email body is directly editable. Users can edit the text, remove specific meters and personalize the message as necessary.
6
Send Email
- Click Send at the bottom of the email panel
- The email will be sent to the selected contacts
- The Reply address is set to the email of the user who generated the data request
- Users who receive the data request email can click the embedded ESPM and Abisko links to directly access their meter
Portfolio Level
Navigate to Portfolio → Property Trends Quickly review properties and send multiple data requests from the Property Trends tab. After setting the reporting period, hover over the row of a property and click on the paper airplane icon that appears next to the property name. Follow the same process as at the property level and quickly continue to the next property.
Click on the column header in the table to sort by Data Completeness in order to quickly identify properties with missing data.