Meter Data Gaps
Gaps are periods of missing meter data that can result in under-reported performance metrics.
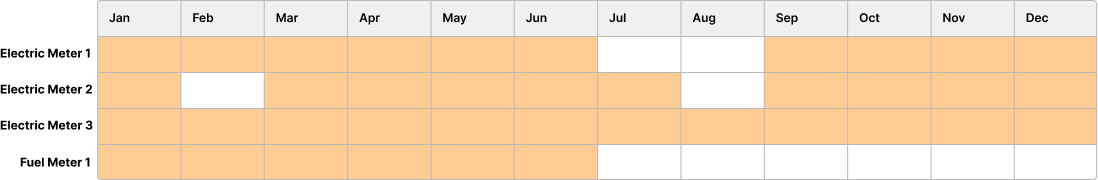
- Middle gaps: Periods of missing data between meter entries.
- e.g. Electric Meter 1: [July / August] & Electric Meter 2: [Feb / August]
- End gaps: Trailing periods of missing data before the first entry or after the last entry within a selected reporting period. Can be caused by a failed utility sync or API connection.
- e.g. Fuel Meter 1
Meter Data Overlaps
Overlaps represent conflicting meter entries that can result in over-reported performance metrics.
Overlaps are automatically recalculated whenever meter data is added, imported, updated, or deleted, ensuring that dashboards and reports always reflect the most current data quality metrics.
Jumps
Jumps may indicate data entry errors or genuine operational changes at a property. In Abisko, they are flagged as warnings, which users can investigate and document using Abisko Notes.Monthly & Annual Jumps
Abisko automatically calculates and reports jumps at the meter, property and portfolio-levels.- Monthly Jumps: Differences of ±50% are flagged when comparing calendar-normalized meter consumption for a given month to the same month in the previous year.
- e.g. A meter has 30,000 kWh consumption for March 2023 and 50,000 kWh for March 2024. This is a difference of 66.7% and Abisko identifies this as a monthly jump.
- Year-over-year Jumps: Percent differences in annual consumption values between the base and reporting periods are reported at the meter, property, and portfolio levels.
- e.g. A property reports total fuel consumption of 1,000,000 kBtu for the base period and 800,000 kBtu for the reporting period. Abisko reports the 20% annual difference with the fuel consumption totals.
Data Quality Workflow
Abisko enables users to identify data quality issues at the portfolio-level and easily drill down to the individual meter where issues can be easily corrected. The following workflow is a common way to start a user session.1
Go to Property Trends (Energy/Emissions/Water/Waste)
After logging in, immediately navigate to the property trends tab.
2
Set Base & Reporting Periods
Immediately set the base & reporting periods to specify the 12-month periods over which you would like to assess data quality and performance.
3
Specify Performance Metric
Use the dropdown menus to select which utility type or subtype you would like to assess (e.g. Total Energy, Electricity, Fuel, DHC, Water)
4
Sort Table Columns
Sort the table via the Meter Warnings, Data Completeness or Percent Change columns to view properties with the most data quality issues in the portfolio.
5
View the Property Data Quality Summary
Click on the property name in the table for which you want to explore more deeply. Once at the property-level, navigate to the Data Quality Tab.
6
Assess Individual Meters
Scroll down and view all the gaps, overlaps and jumps identified for every meter over the reporting period.
Viewing Data Quality Metrics
Portfolio Level
Navigate to Portfolio → Property Trends In addition to property-level data completeness and coverage metrics, users can view a summary of all meter-level warnings identified for the property across the base and reporting periods by hovering the mouse over the Meter Warnings cell of the property. Users can then click into the property to identify the specific gaps, overlaps and jumps associated with each meter.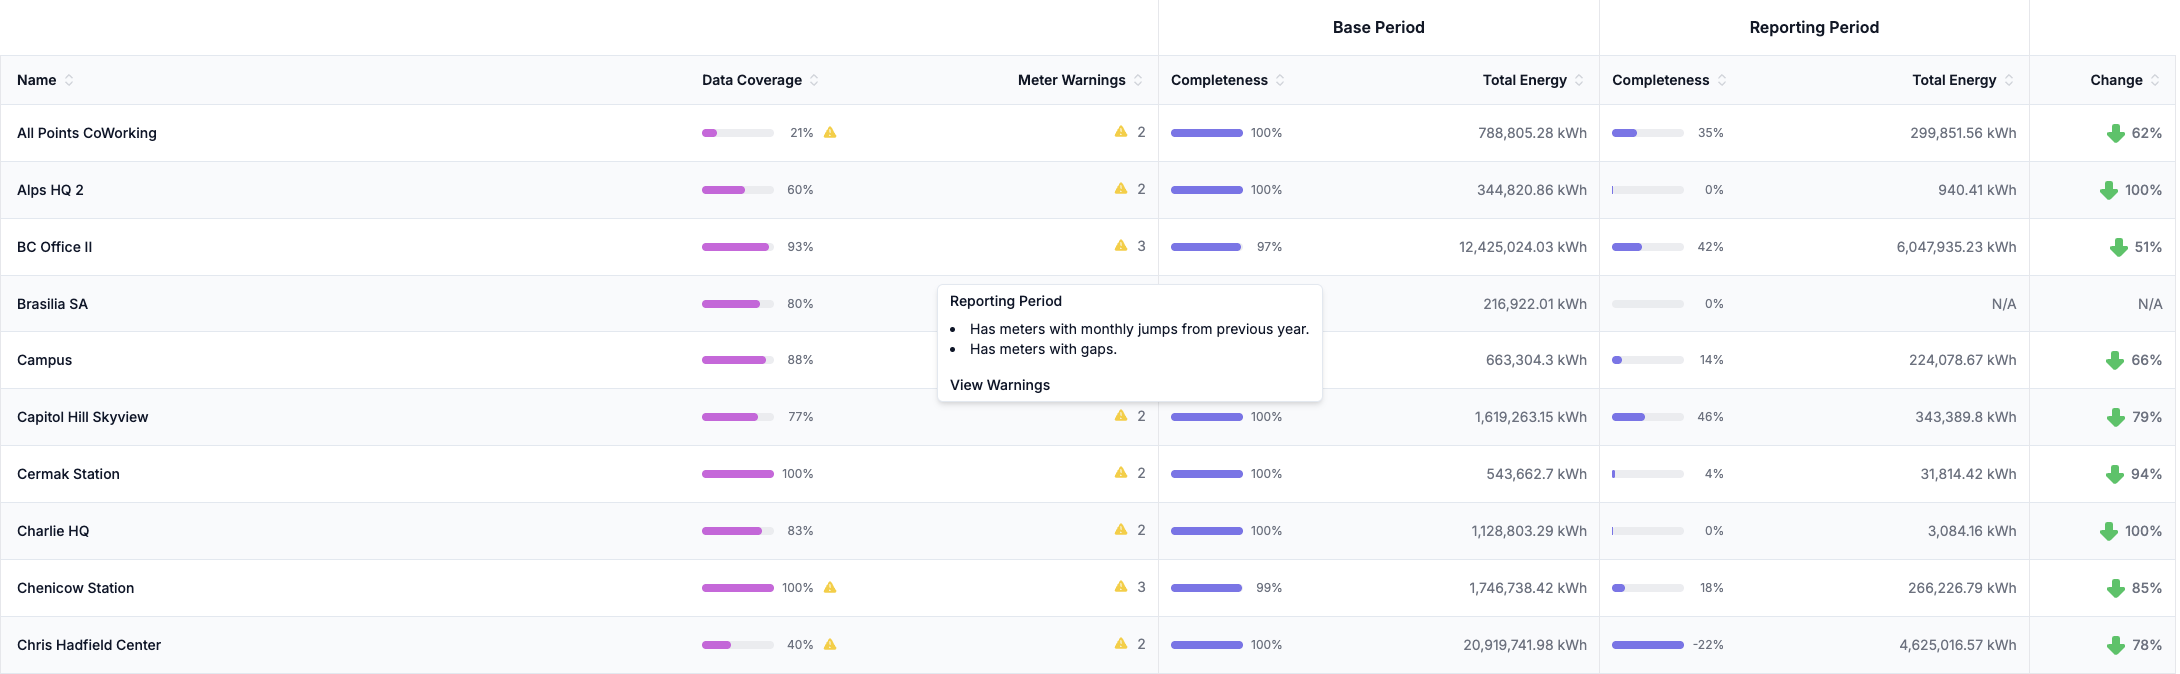
Property Level
Navigate to Property → Data Quality View a property-level data quality summary with a list of all in-metric meters and their identified gaps, overlaps and monthly jumps in the Data Quality tab.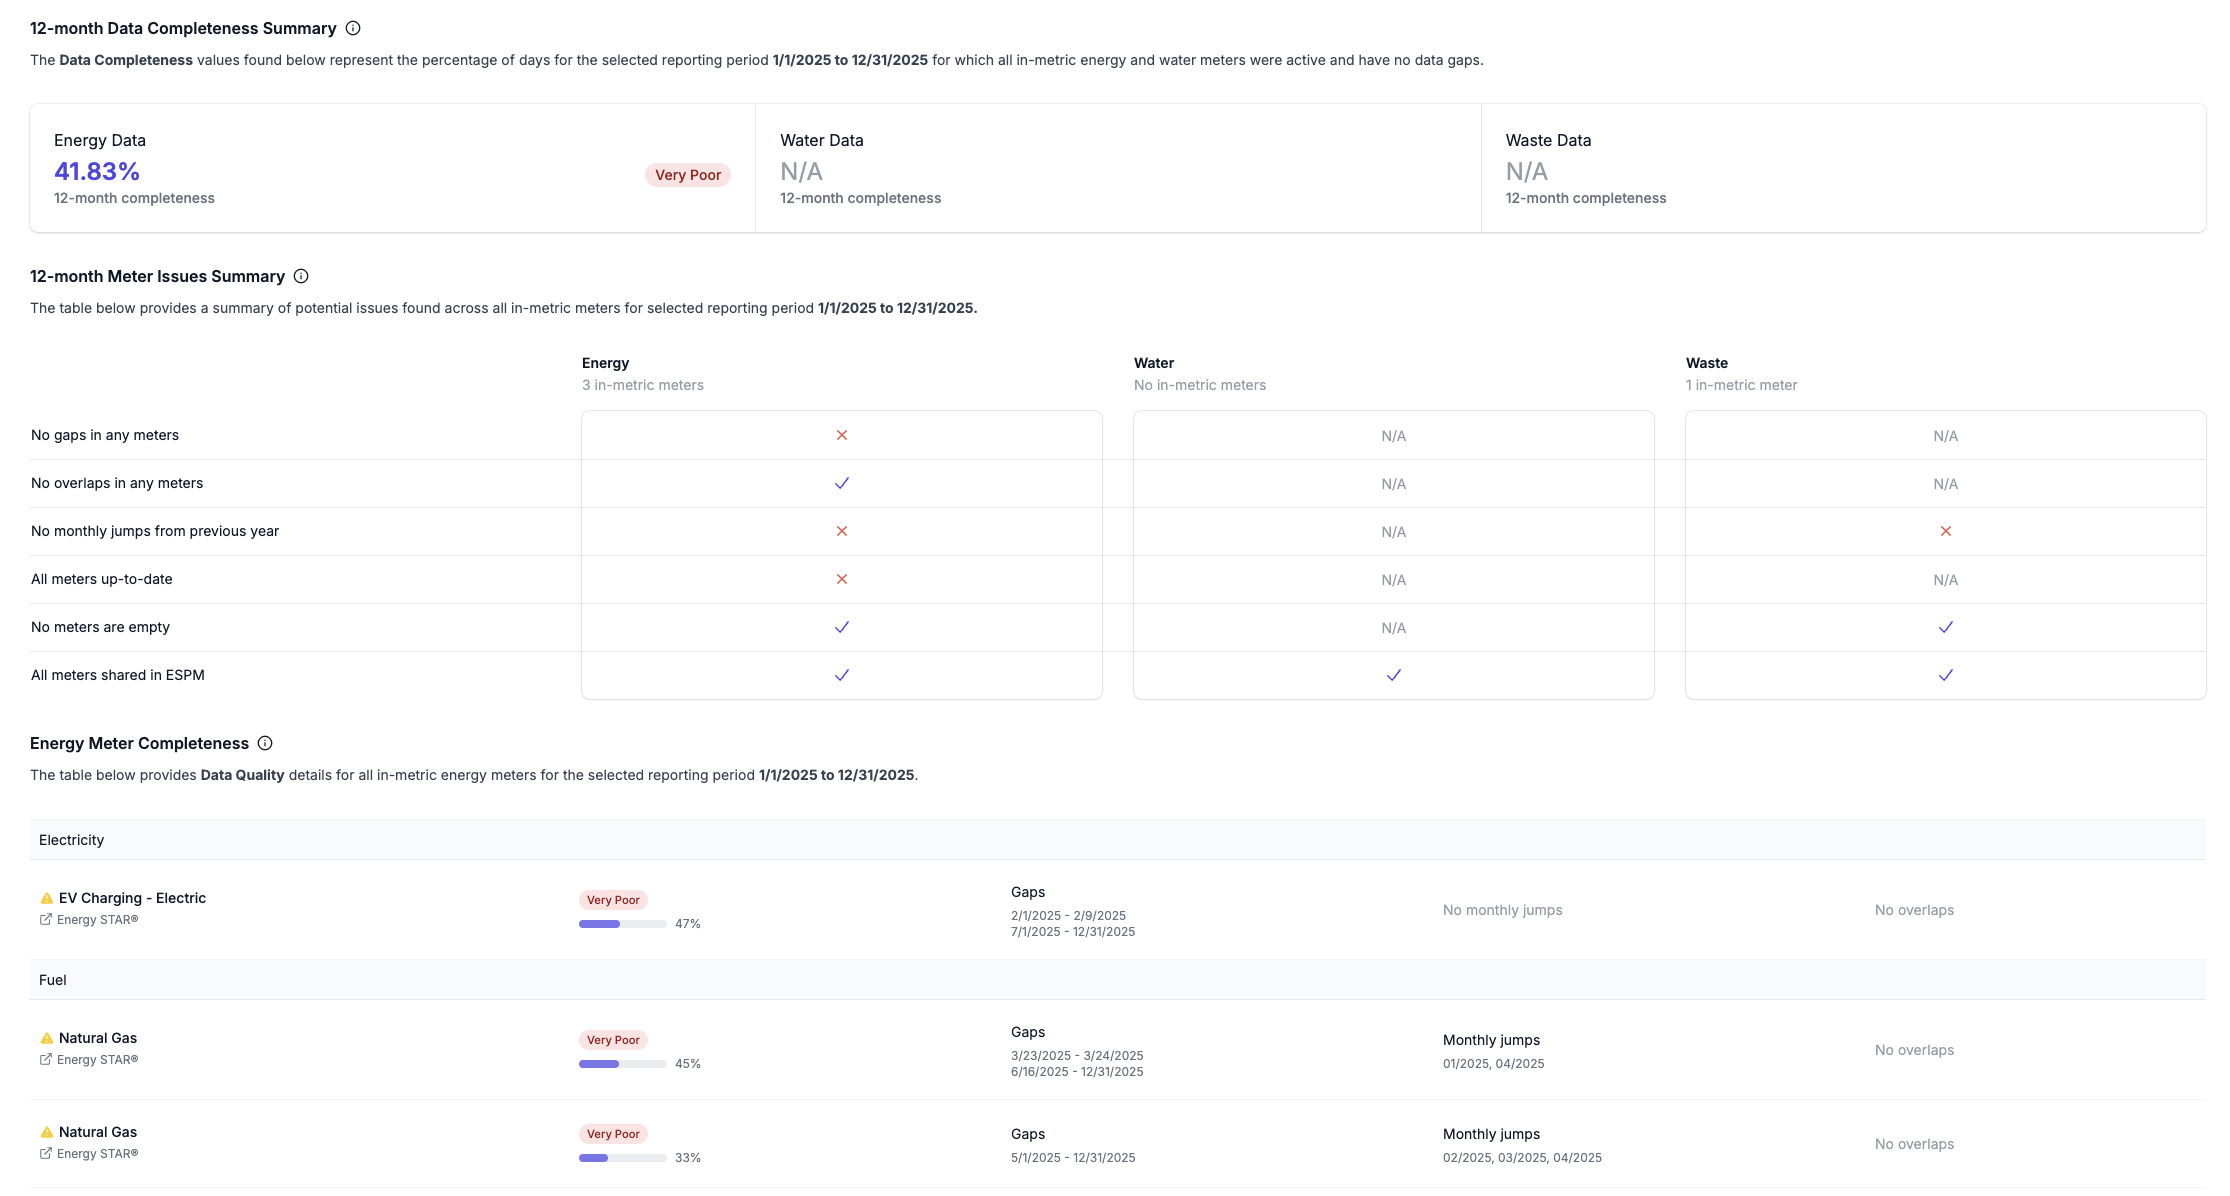

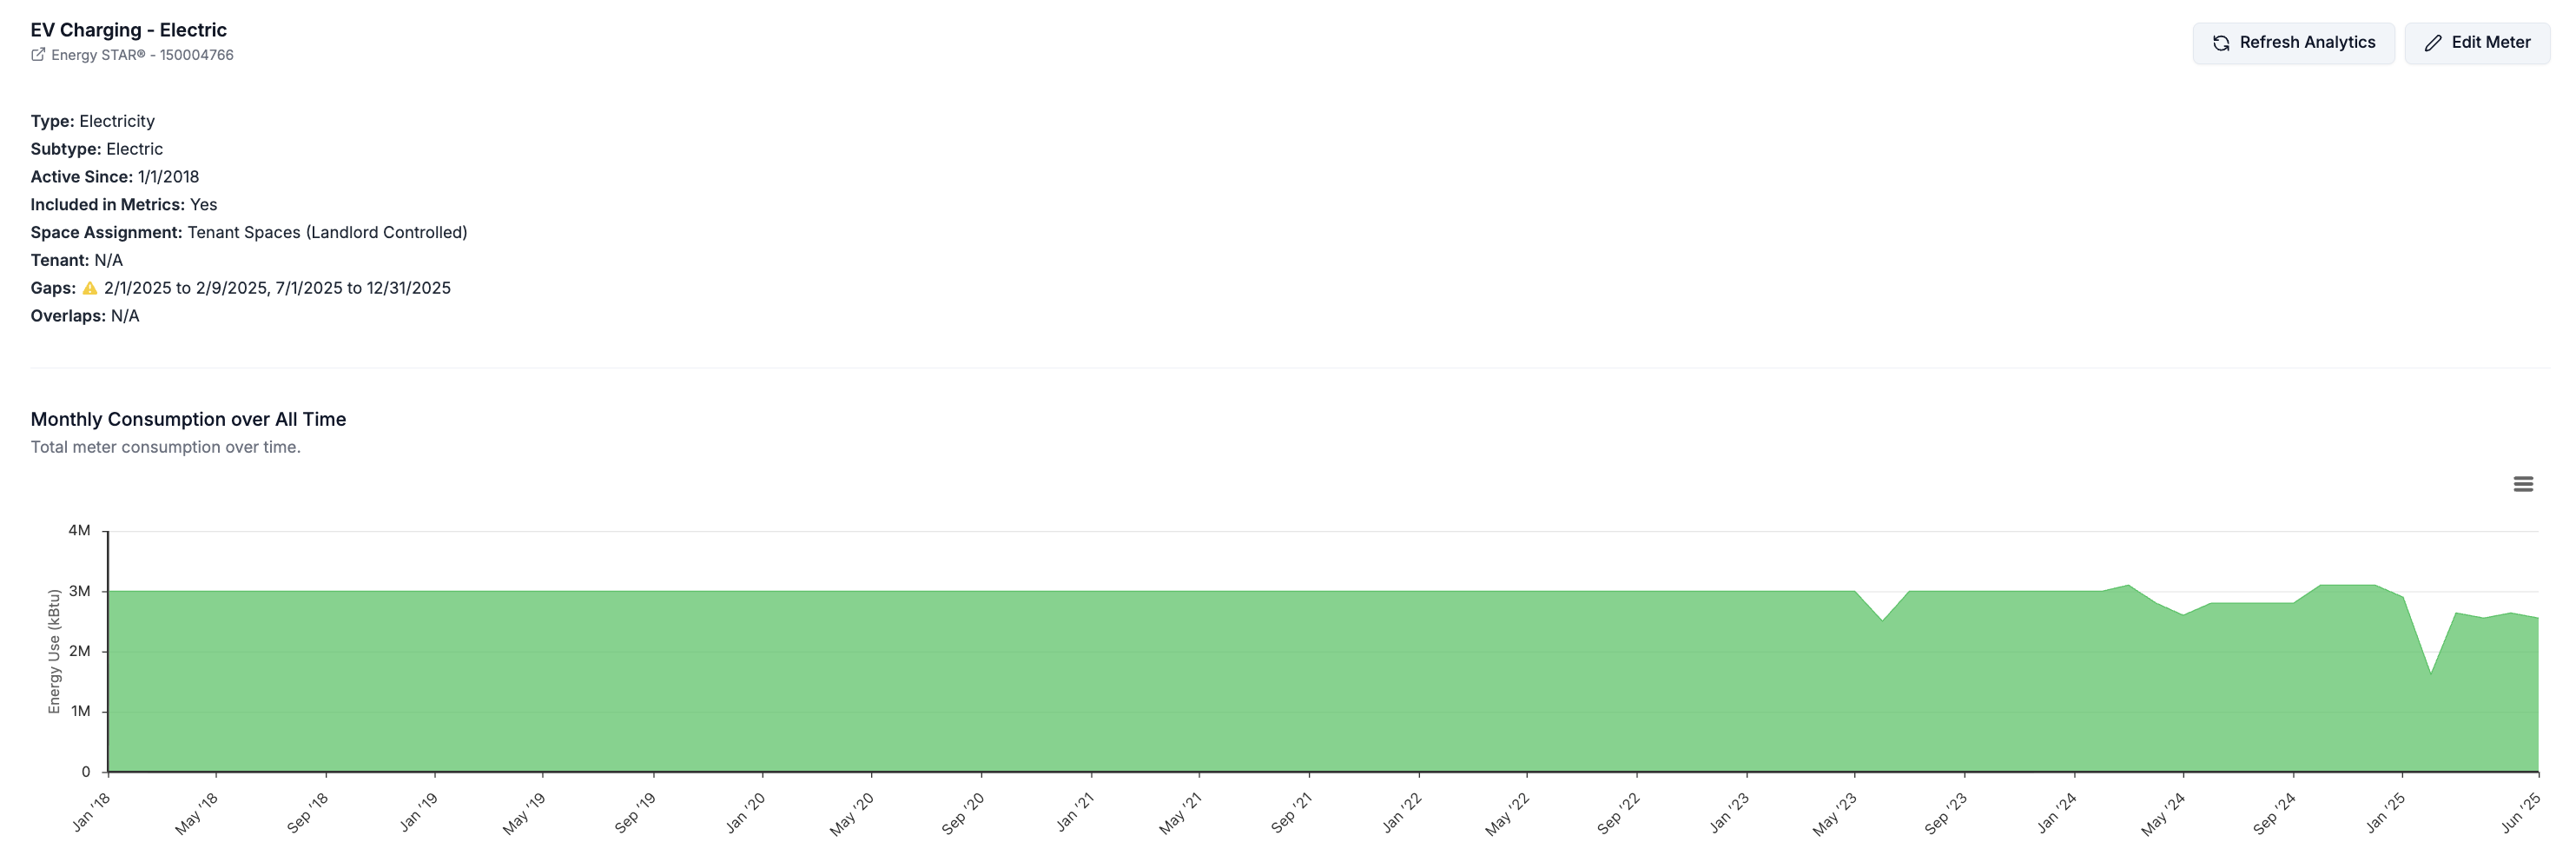
Meter Level
Navigate to Property → Meters → Meter Page Click into a specific meter to quickly view all meter configuration details, gaps, overlaps and monthly jumps in one place.