CRREM (Carbon Risk Real Estate Monitor)
CRREM provides science-based benchmarks that investors, asset managers and industry frameworks rely on to assess transition risk in real estate. Abisko enables users to assess energy and carbon performance relative to CRREM benchmarks and to create decarbonization strategies that mitigate transition risk across portfolios.Resources
Property Level
Users can evaluate the performance of their properties against CRREM targets. Navigate to Property → CRREM (Energy, Emissions)- Select the Reporting Period
- Select the relevant pathway
- Confirm the selected CRREM curve
Energy Reduction Pathway
The property-level CRREM tab defaults to the Energy Reduction Pathway, which allows users to compare reporting period Site EUI against annual CRREM targets through 2050.Emissions Reduction Pathway
By clicking on the Emissions sub-tab, users can compare the reporting period GHGi against annual CRREM targets through 2050.CRREM Curve
The CRREM curve is automatically selected based on the property type and location:- United States → CRREM curve selected based on postal code.
- Canada → CRREM curve selected based on province.
- Australia → CRREM curve selected based on climate zone.
- Other Countries → CRREM curve based on country.
Users can edit the CRREM pathway by clicking CRREM Settings at the top-right of the page.
Analyze CRREM Exposure
The top section displays the misalignment year, which represents the first year in which the Site EUI or GHGi exceeds the 1.5°C CRREM target, as well as supporting metrics based on selected decarbonization measures.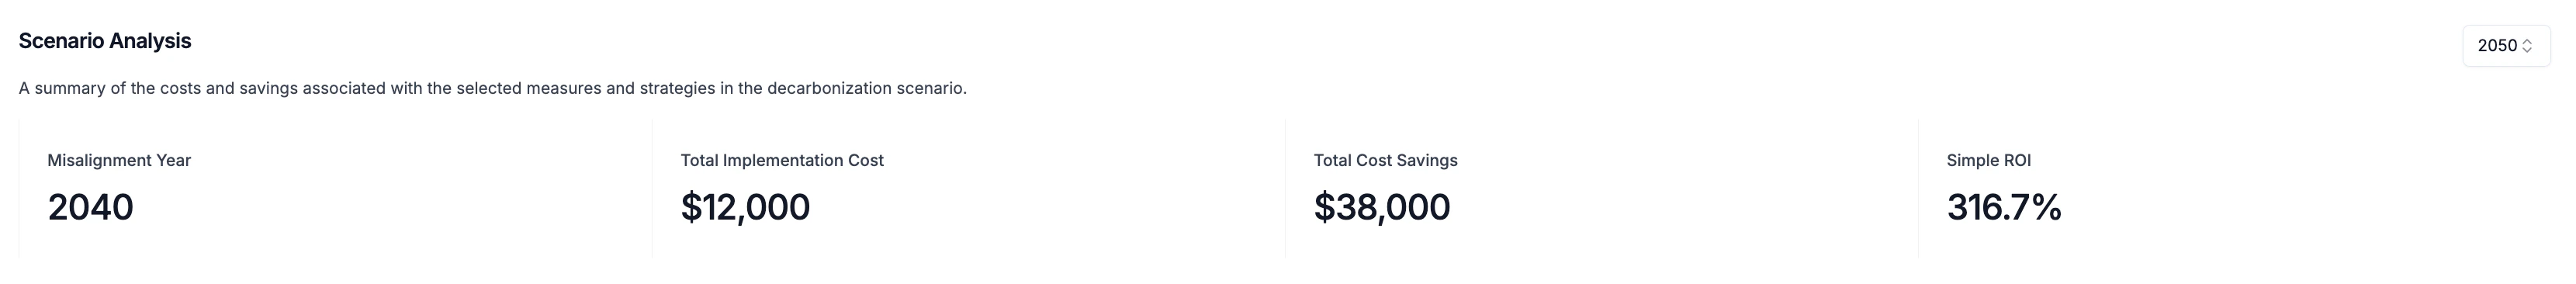
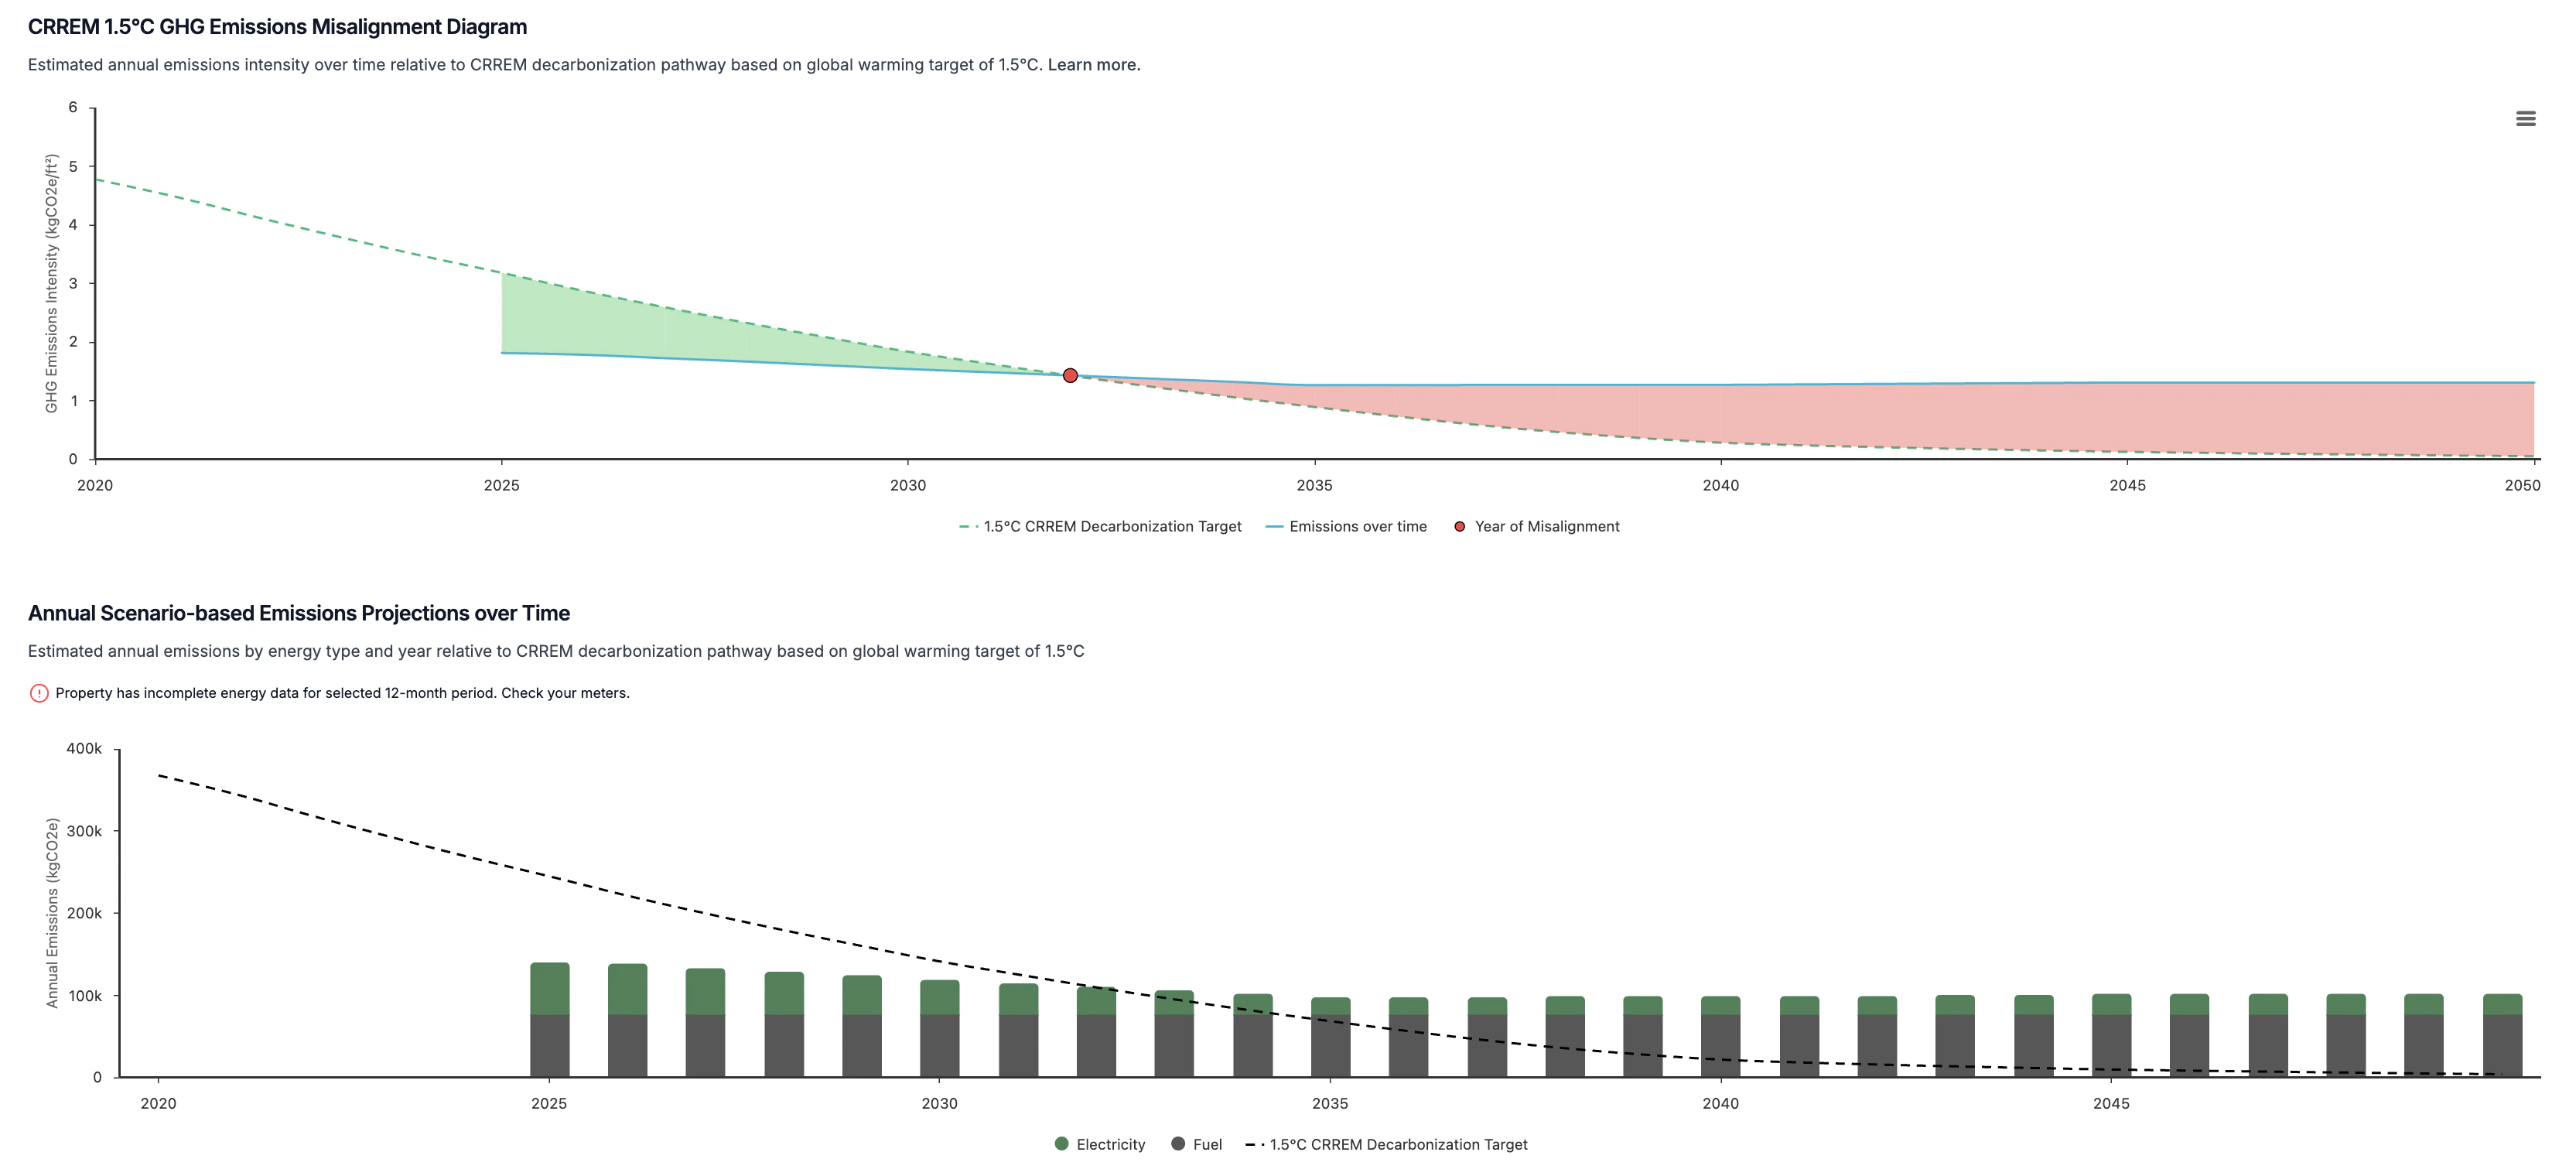
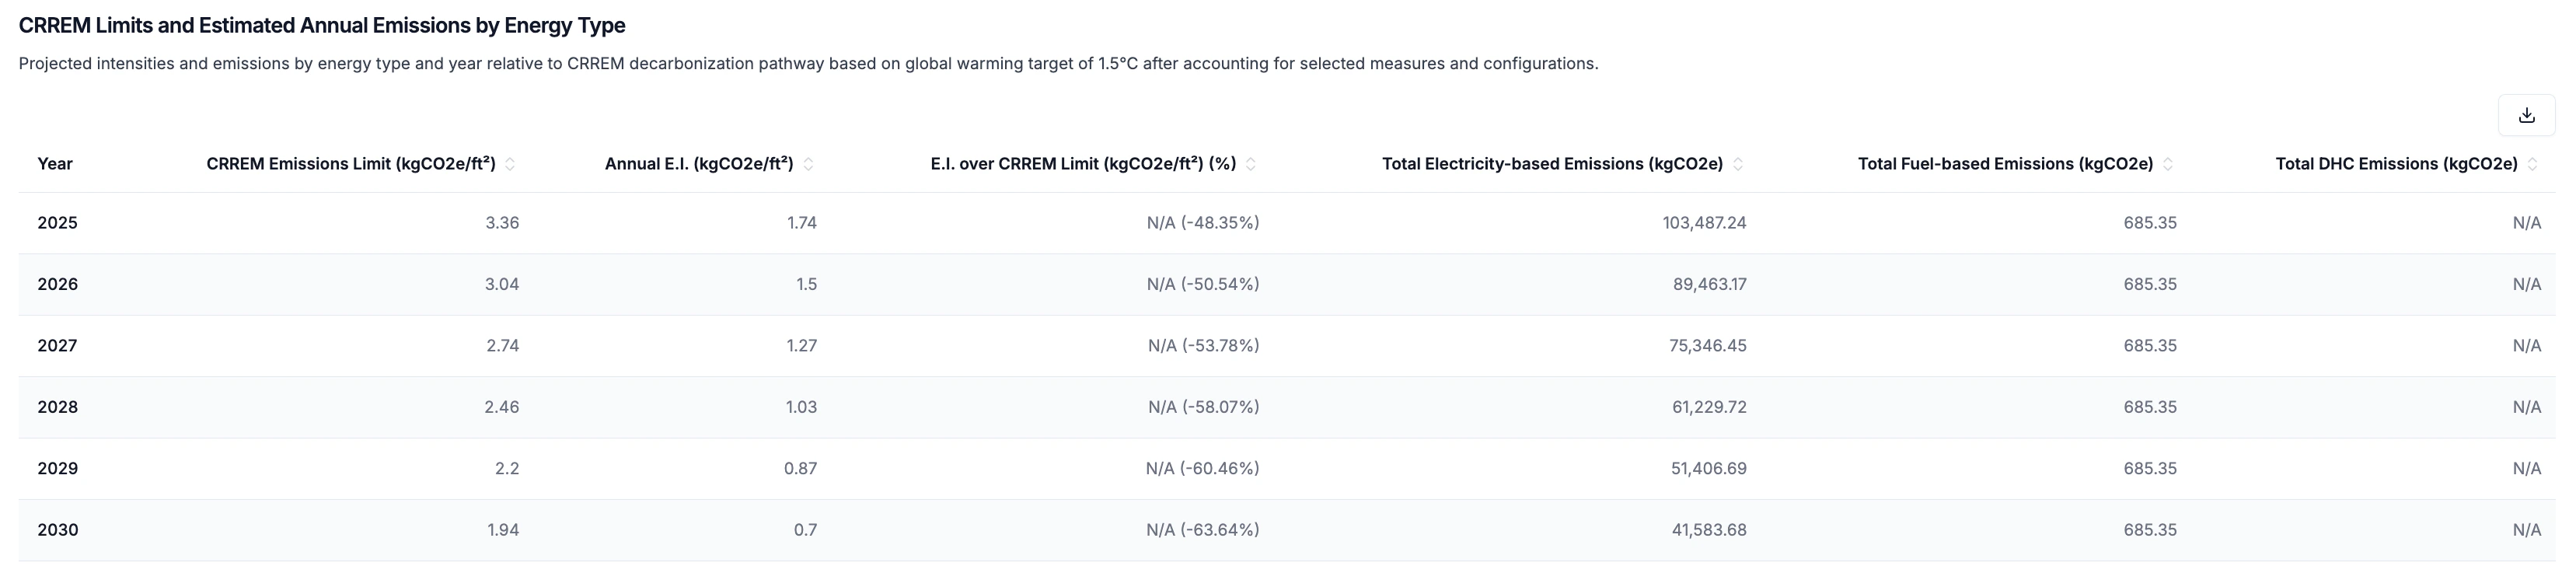
The default setting applies projected emissions factors provided by CRREM. Users can uncheck the box to analyze performance using static emissions factors from the reporting period.
Decarbonization Pathways
Abisko enables users to model different combinations of measures and see how each scenario affects property performance relative to CRREM targets. This allows users to align long-term decarbonization strategies with CRREM targets and other capital planning efforts. With this feature, users can:- Test different decarbonization pathways against CRREM energy & emissions targets
- Identify the most cost-effective emissions reduction strategies
Select Measures
Property → CRREM (Energy, Emissions)- Click on the Select Measures button
- Open the CRREM Measures Selection panel
- Check the box next to each measure that should be included in the compliance analysis
- If the panel is empty, click the link to Add New Measures
- Check the box above the table to automatically select all measures
- Click save after finalizing the measure selection
- Check the box next to each measure that should be included in the compliance analysis
Review Charts & Tables
After saving the selection, all charts and tables in the report will automatically update to show the impact of each measure on the property’s energy and/or emissions.- Proposed measure impacts will begin to take effect on the calendar year following the completion date of the measure.
- e.g. if completion date = 5/5/2028, changes begin to take effect 2029
- Absolute values entered for each energy subtype are subtracted from the total annual consumption of that subtype for the selected reporting period.
- Percentage values entered for each energy subtype are converted to absolute values by multiplying the percentage by the total annual consumption of that subtype for the selected reporting period. The converted value is then treated as an absolute value.
- Measures are applied independently (no interactive effects) and total reductions for each energy subtype are capped by the total subtype consumption of the reporting period.
- e.g. If 20 measures include 10% annual electricity savings, this will be capped to 100% annual electricity savings, resulting in 0 electricity-related emissions
- Annual energy savings are additive and persist over time
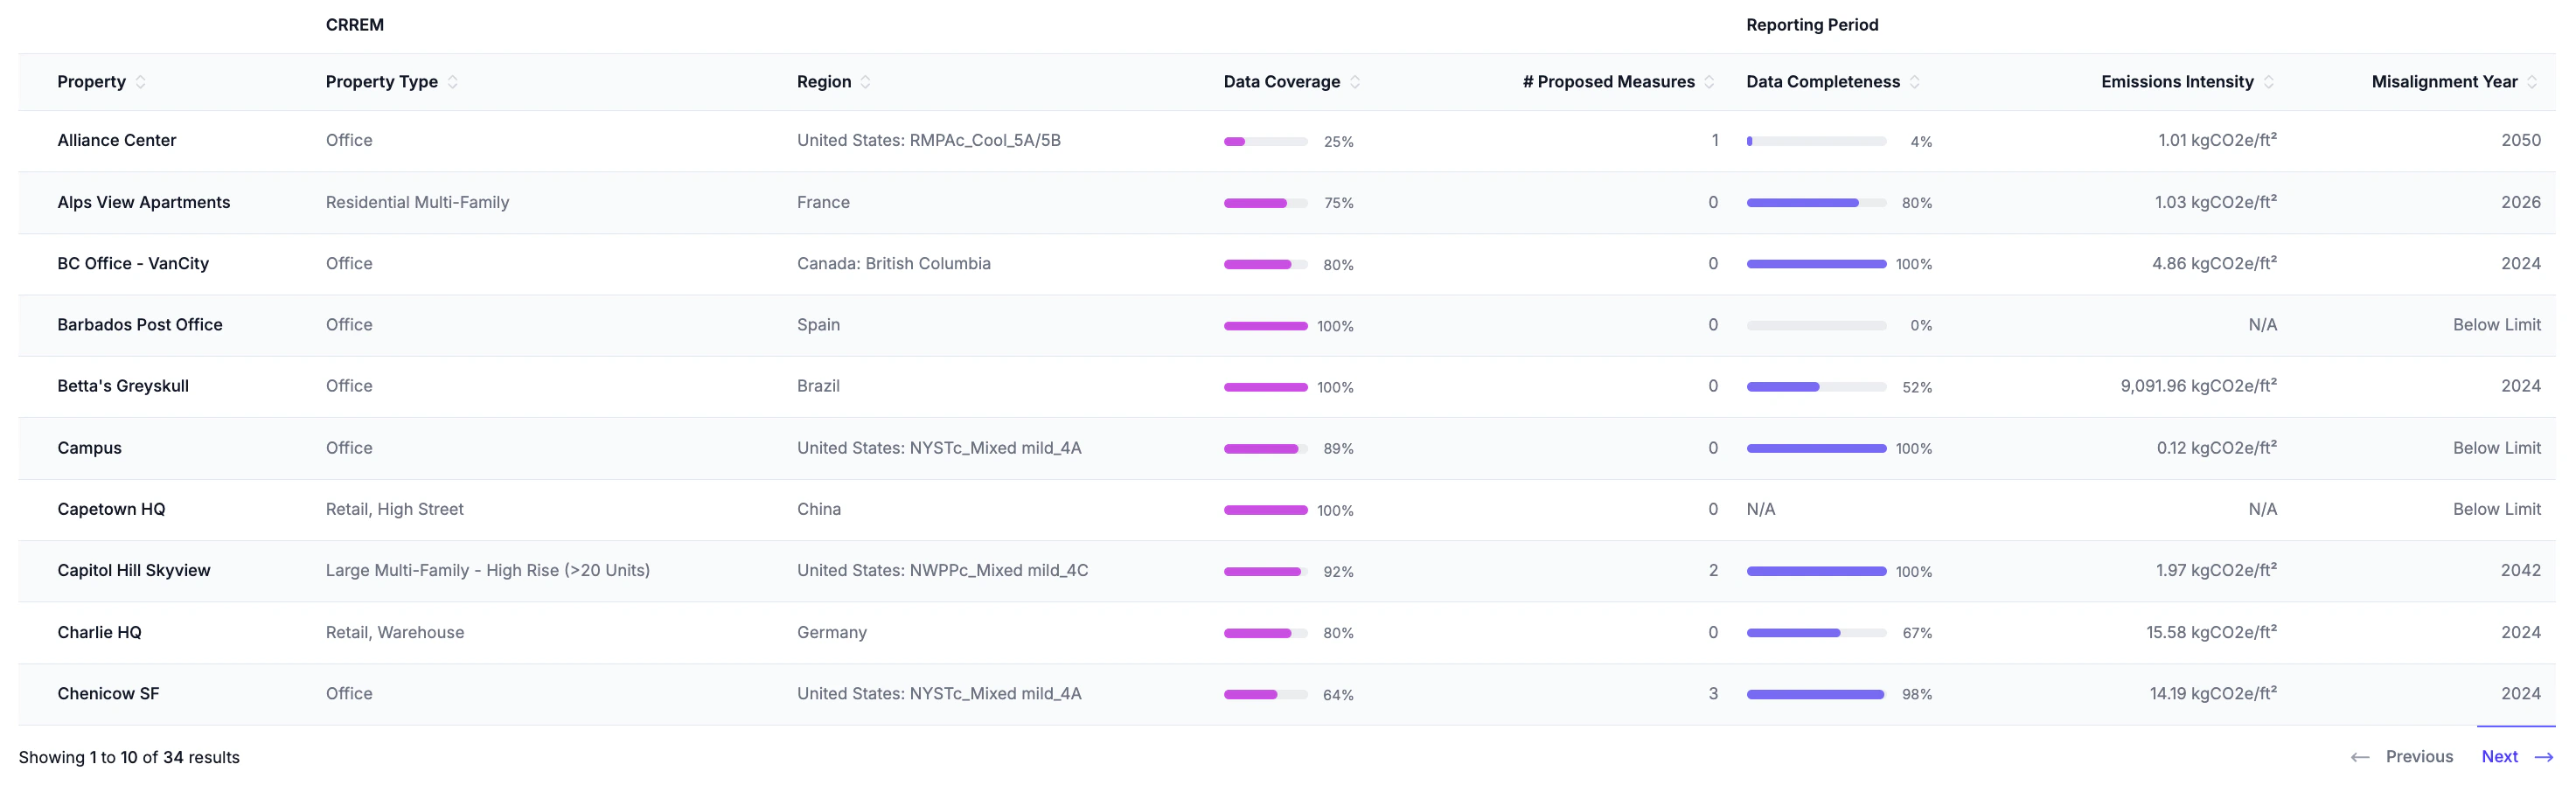
Portfolio Level
Users can evaluate the performance of their portfolio against CRREM targets. Navigate to Portfolio → CRREM (Energy, Emissions) Portfolio-level targets are calculated as a gross-floor-area-weighted average of each property’s individual annual CRREM target.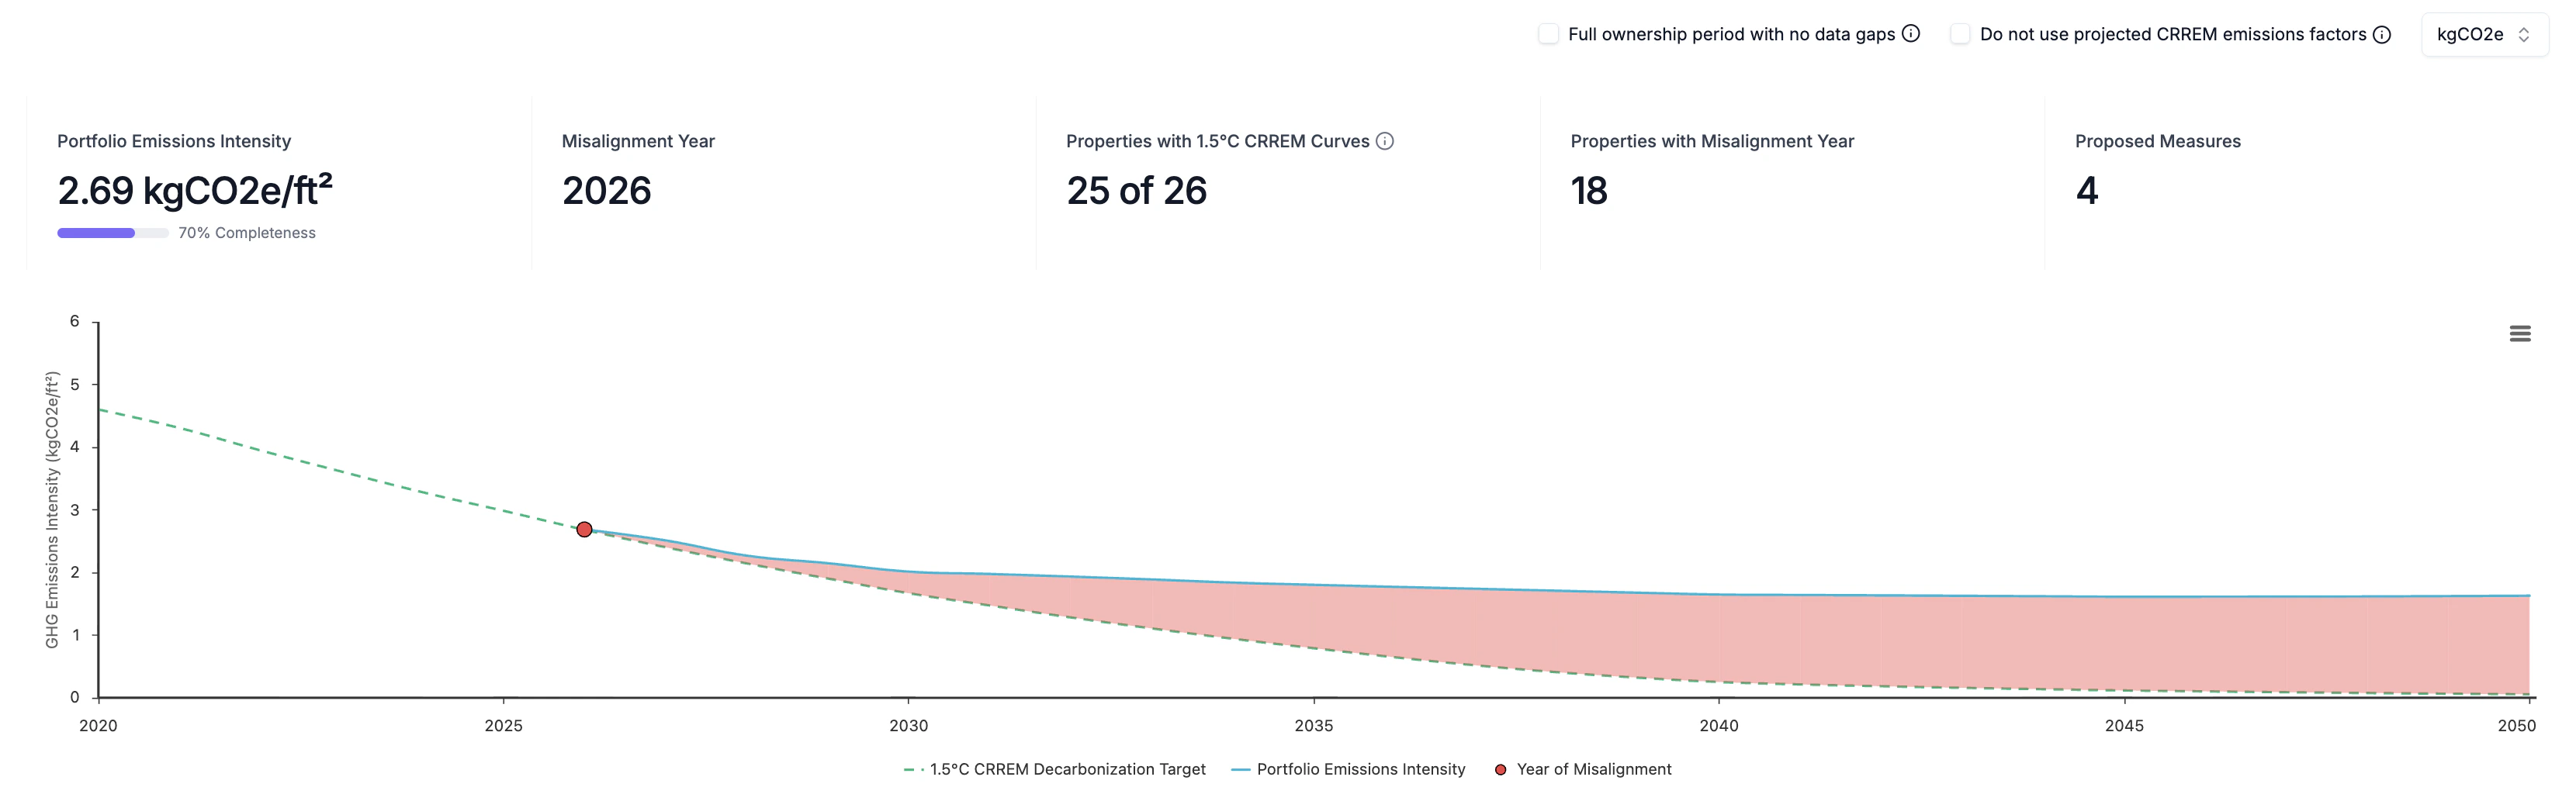
- Portfolio EUI/GHGi: The gross-floor-area-weighted average of each property’s individual annual EUI/GHGi across the portfolio with corresponding annual energy data completeness.
- Misalignment Year: The first year that the Portfolio EUI/GHGi exceeds the gross-floor-area-weighted average annual CRREM target.
- Properties with CRREM Curves: The number of properties in the portfolio for which a CRREM curve has been saved. Only properties with valid CRREM curves are included in the portfolio-level analysis.
- Properties with Misalignment Year: The number of properties for which EUI/GHGi is expected to exceed annual CRREM targets before 2050.
- Proposed Measures: The number of proposed measures that have been selected across properties for decarbonization planning relative to CRREM pathways.
The default setting applies projected emissions factors for each property provided by CRREM. Users can uncheck the box to use static emissions factors.