Dashboard
Navigate to Portfolio → Green Power → Green Power TrendsPortfolio Statistics
At the top of the dashboard, a number of portfolio-level statistics are displayed based on green power totals calculated for the selected reporting period.
- Percent Green Electricity: The percent of the total electricity consumed by properties across the portfolio that is counted as green power.
- Total Green Power - Offsite: The total amount of offsite green power that is counted for properties across the portfolio.
- Total Green Power - Onsite: The total amount of onsite green power that is counted for properties across the portfolio.
- Properties with Green Power: The number of properties with any onsite or offsite green power recorded over the selected reporting period.
- Onsite PV Systems: The number of onsite PV systems tracked for properties across the portfolio.
Total Electricity Breakdown by Property
This plot displays all properties in the portfolio with a breakdown of electricity consumption by type. The gray portion of each bar represents non-renewable grid electricity consumed during the reporting year, while the green portion represents green power.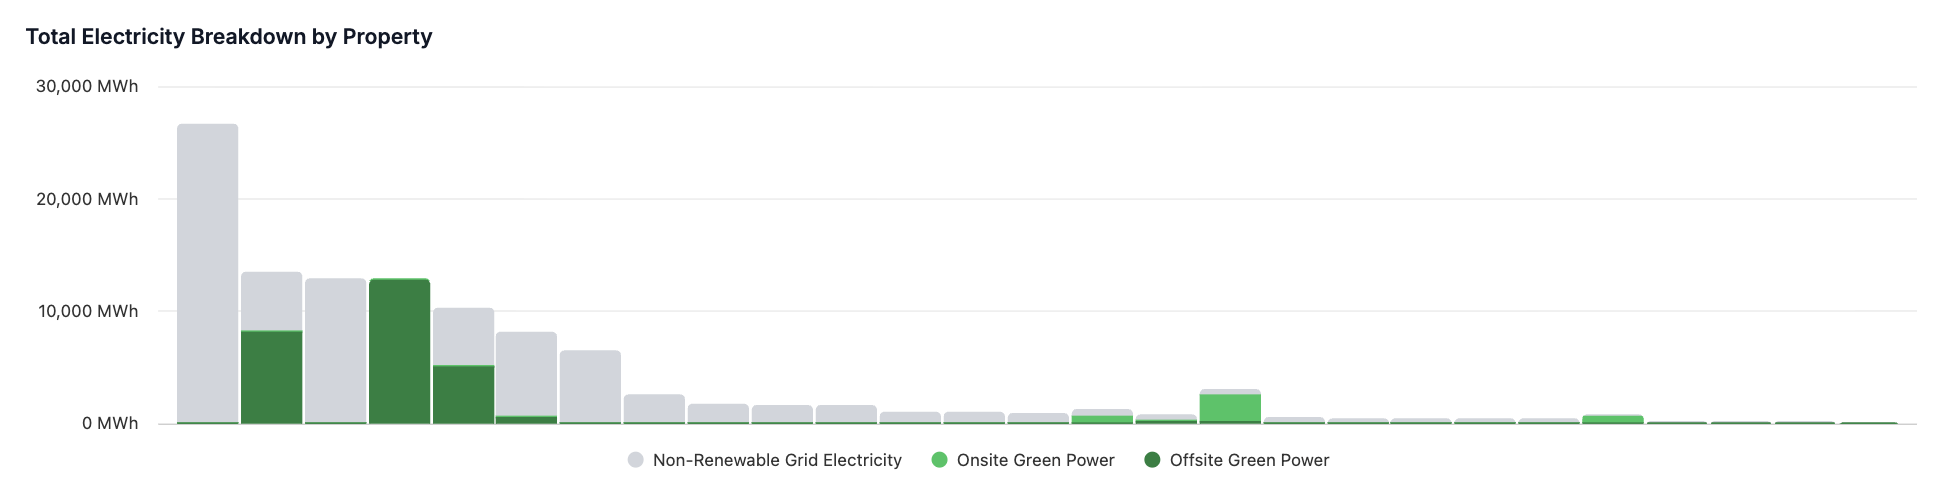
Annual Portfolio Electricity vs. Green Power
This plot shows annual, portfolio-level aggregates of total electricity consumption and green power across multiple years.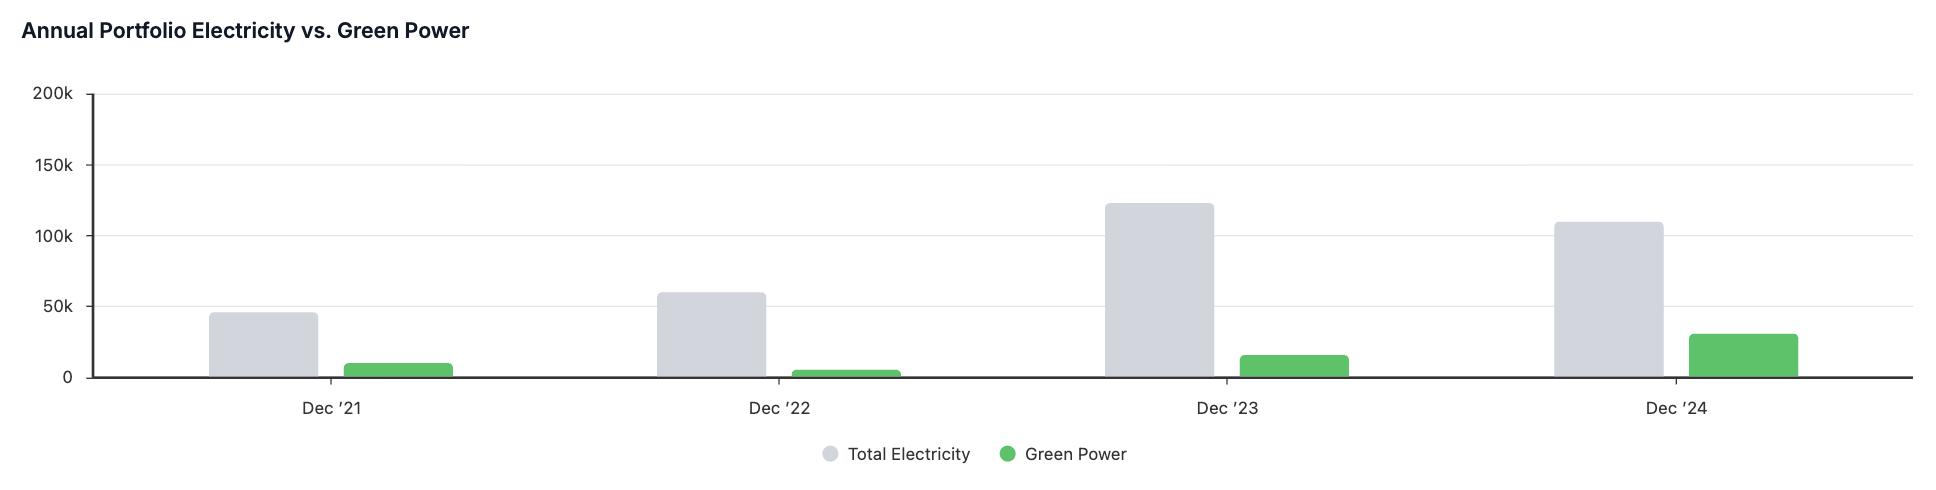
Annual & Monthly Green Power by Subtype
These plots provide a granular breakdown of green power based on renewable energy certificate (REC) ownership, consistent with GHG Protocol market-based accounting. Users can track green power sourced from purchased instruments (e.g., PPAs, green tariffs, unbundled RECs) as well as from onsite renewable generation that is consumed onsite and electricity exported to the grid.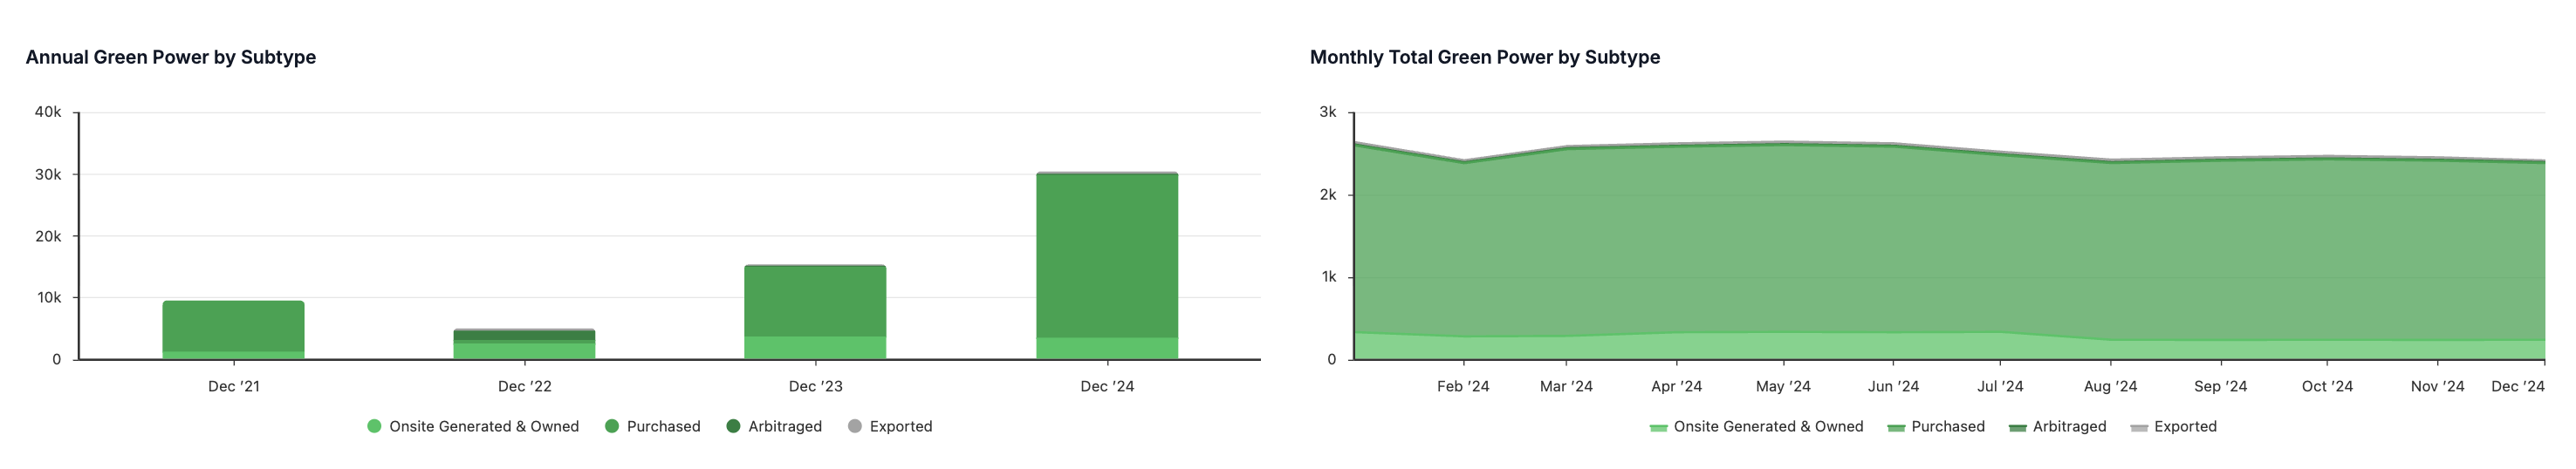
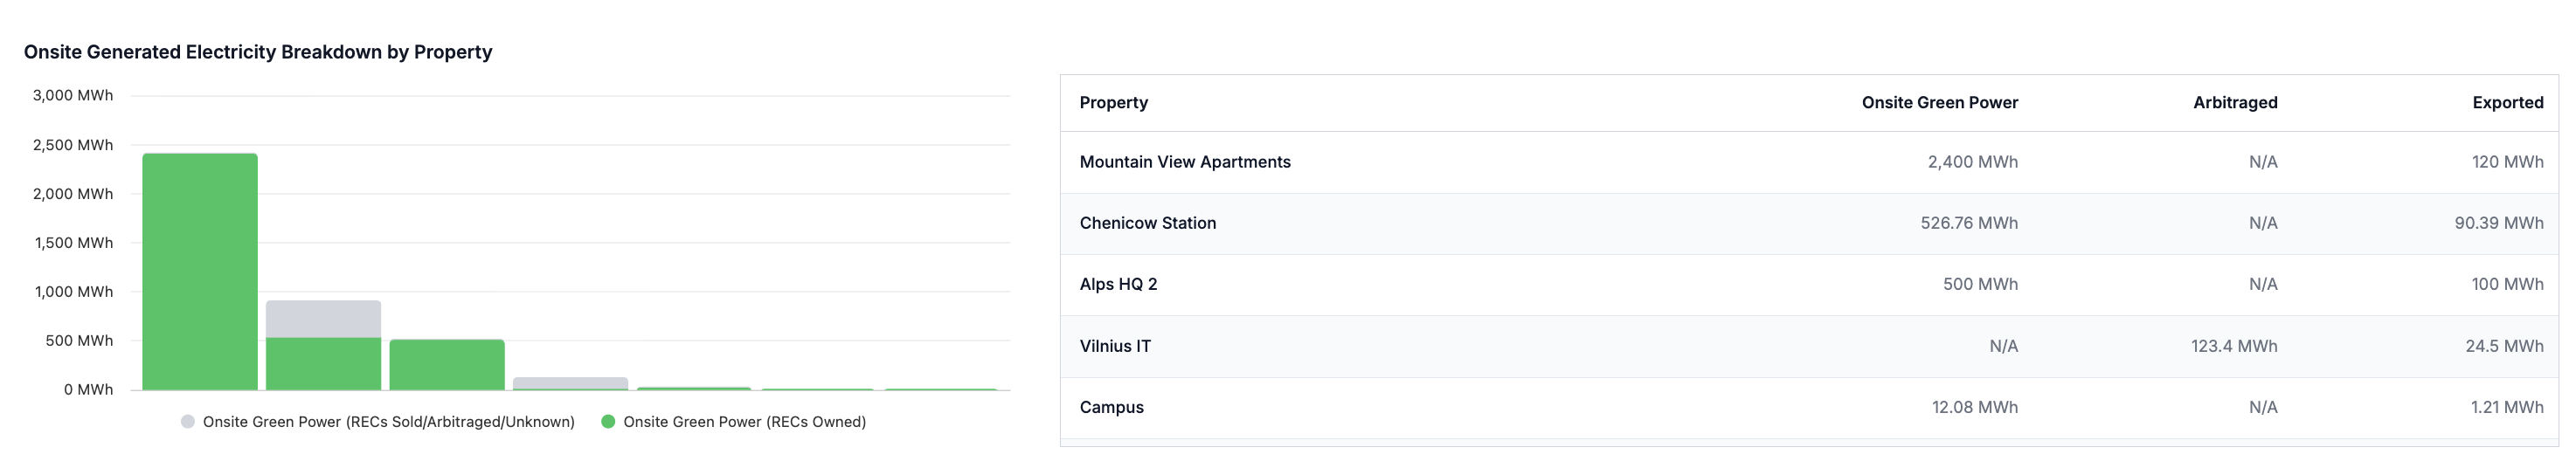
Onsite Generated Electricity Breakdown by Property
This section presents a breakdown of all onsite electricity generation across properties with solar and wind meters. Users can track how much electricity was generated and how the associated RECs were owned, sold, or arbitraged, enabling them to understand how onsite generation contributes to reductions in both location-based and market-based emissions.Onsite-generated electricity for which RECs are sold or arbitraged is treated as regular grid electricity when calculating location-based emissions, in accordance with GHG Protocol guidance.
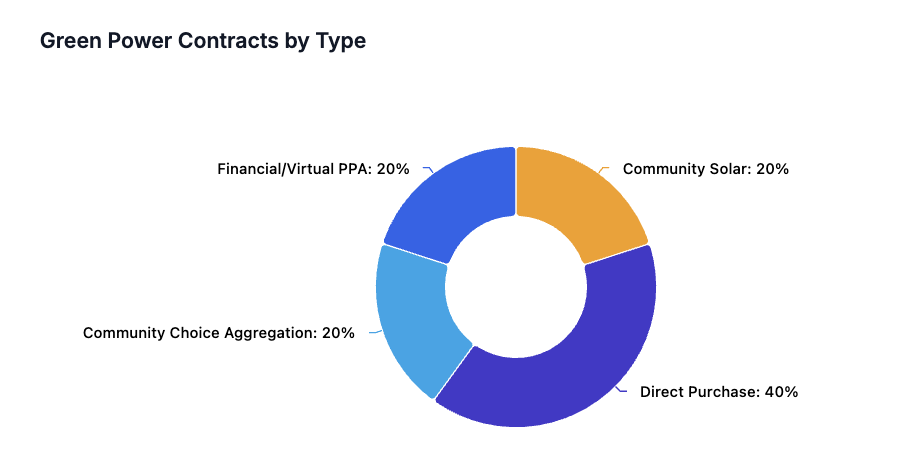
Green Power Contracts by Type
This pie chart provides a breakdown of all types of green power purchases that occurred during the selected reporting period.