Benchmarks
Abisko enables users to easily identify properties with unusually high or low energy, emissions, and water intensities by providing a range of performance benchmarks for evaluation. These benchmarks also help users prioritize underperforming properties and effectively guide decarbonization efforts.
Key benchmarks available at both the property and portfolio level include:
- ASHRAE 100: Aspirational efficiency targets (Site EUI, GHGi)
- CBECS: National medians (Site EUI)
- EPA WaterSense: Water intensity benchmarks (WUI at 25th, 50th, 75th percentiles)
- DOE Building Performance Database (BPD): Accurate and targeted benchmarks for EUI, GHGi, Fuel Intensity, and Electric Intensity based on regulatory filings
For BPD benchmarks, property performance is evaluated against more than 400,000 verified performance records from benchmarking and Building Performance Standard (BPS) policy submissions across North America. This dataset represents the largest and most comprehensive repository of verified building performance data globally and enables precise benchmarking that accounts for multiple parameters, including property type, property size, and climate zone.
Property Level
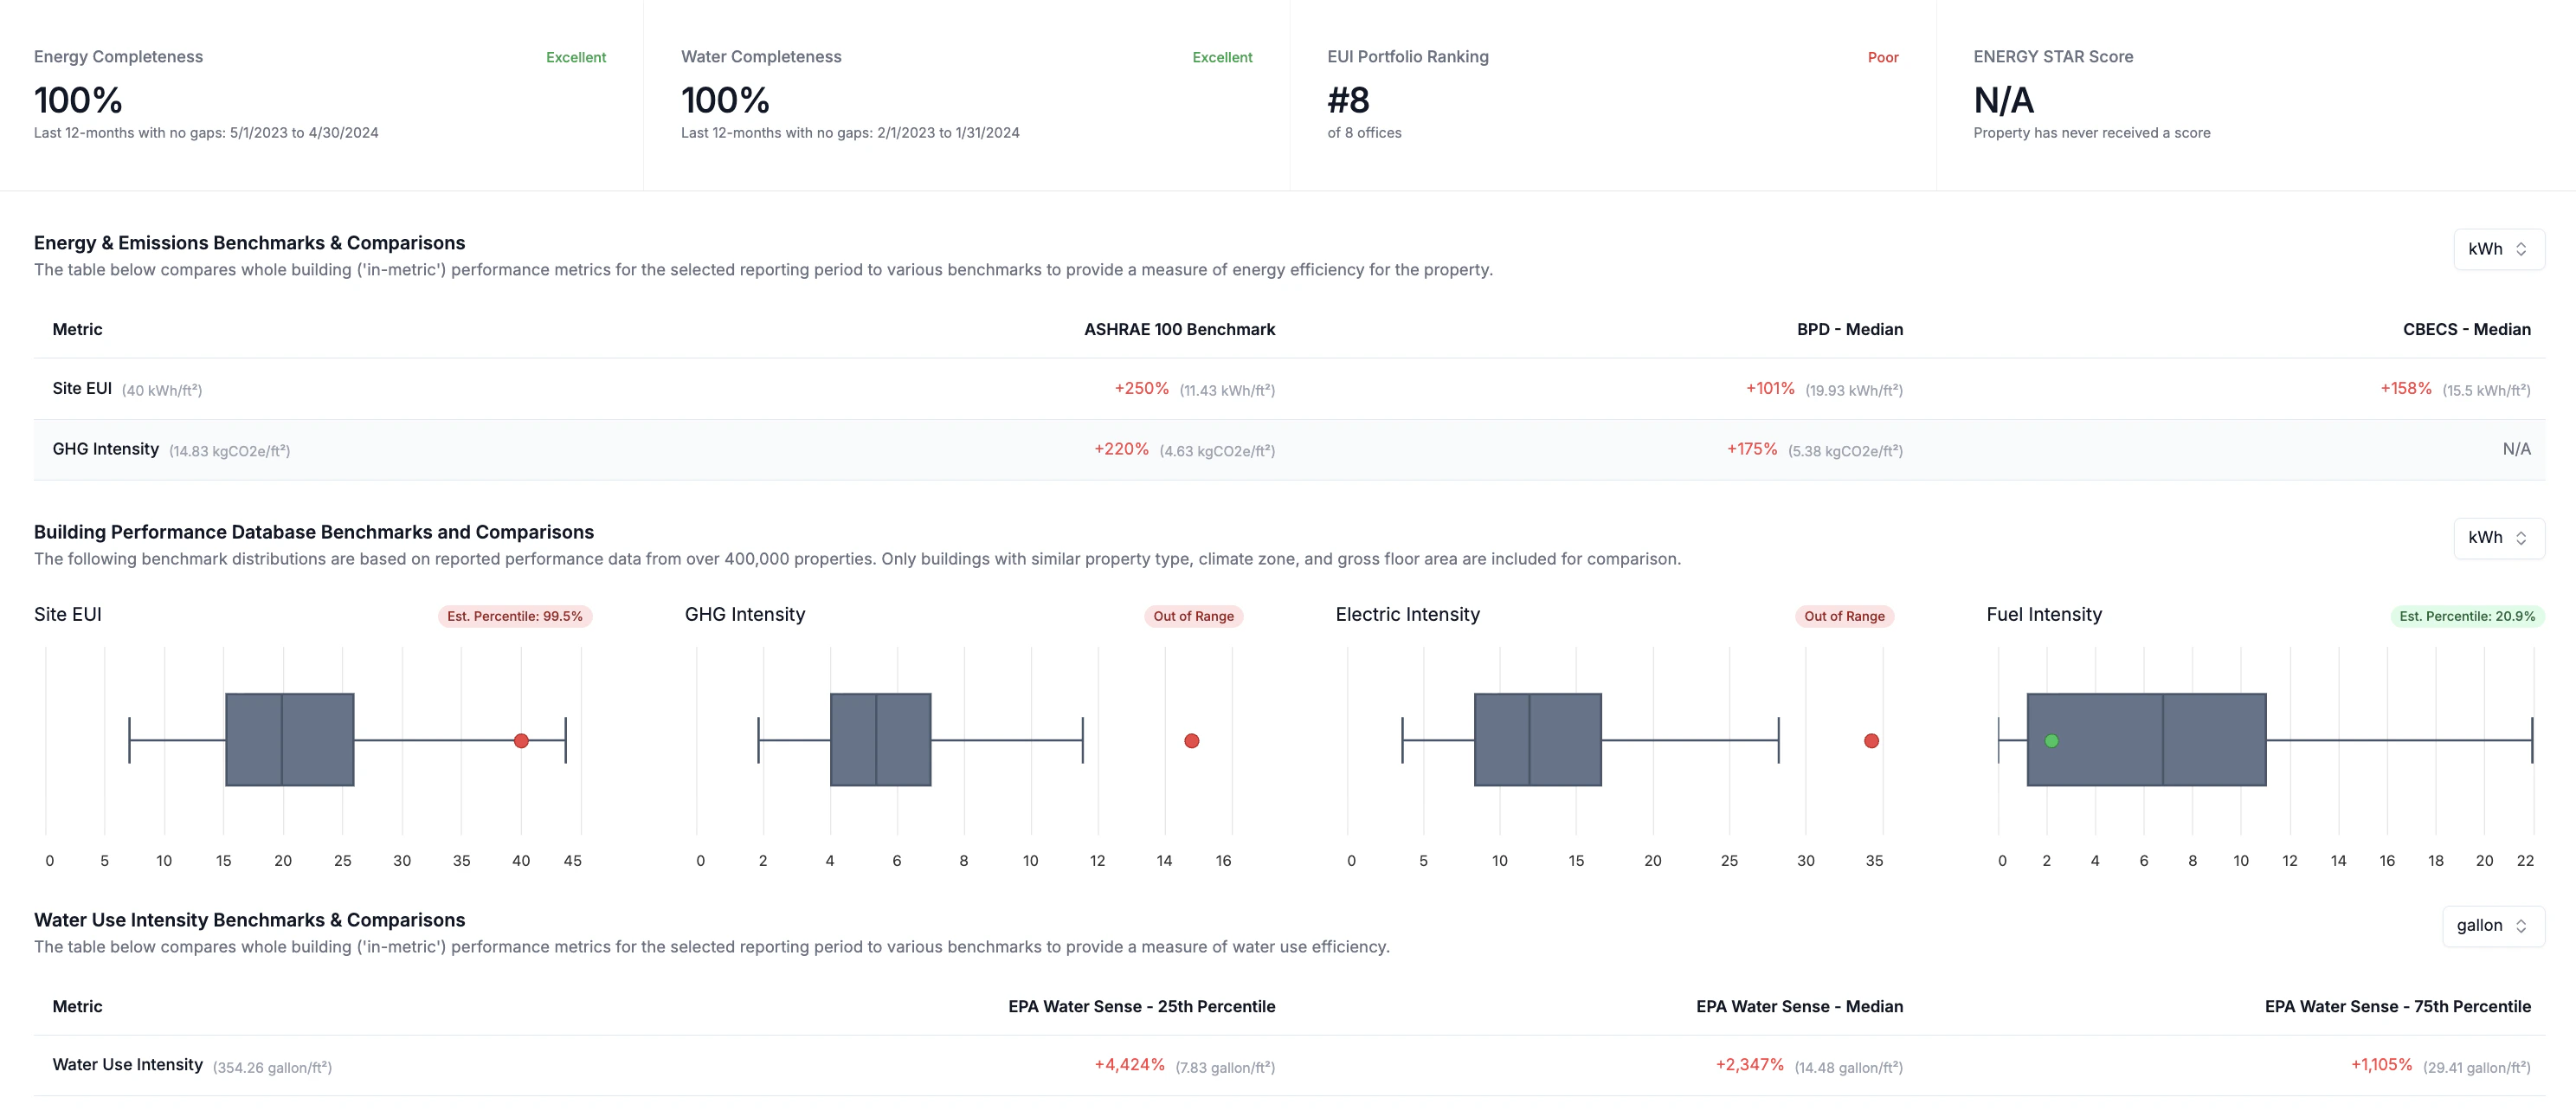
Users can further evaluate the performance of a property against relevant energy, emissions and water benchmarks with additional details at the property level. The property dashboard displays data completeness values along with all EUI, GHGi and WUI benchmarks.
Navigate to Portfolio → Dashboard
Hover the mouse over each boxplot to learn more about the dataset behind each distribution.
Portfolio Level
Users can evaluate the performance of all properties in a portfolio against relevant energy, emissions and water benchmarks.
Navigate to Portfolio → Property Trends (Energy, Emissions, Water)
- Select the Reporting Period
- Select an intensity metric (e.g. EUI, GHGi, WUI) using the dropdown menu
- Click the Columns button above the property table to the right
-
Select the benchmark(s) against which to evaluate performance
-
Benchmark values display both the percent difference relative to the property’s reporting period performance and the actual benchmark value
Users should always reference the property data completeness value when evaluating benchmark results to minimize the risk of comparing against underreported metrics.
- After the table refreshes, sort the table via the benchmarking columns to view top and bottom performing assets and outliers
See how to evaluate performance against benchmarks.