> ## Documentation Index
> Fetch the complete documentation index at: https://docs.abisko.io/llms.txt
> Use this file to discover all available pages before exploring further.
# Energy
> Energy performance metrics & calculations across spaces.
Users can track energy consumption and trends across different space types within properties and across portfolios. Space-based analytics support a deeper level of decarbonization planning that differentiates between landlord and tenant-based strategies and allows users to take more targeted action to reduce energy-use.
## Performance Metrics
Users can track and report performance, data completeness and data coverage for each space type and energy type.
| Space Type | Consumption, Completeness, Coverage |
| :------------------------------------------------- | :---------------------------------- |
| Base Building (All) | Total Energy |
| Base Building (All) | Electricity |
| Base Building (All) | Fuel |
| Base Building (All) | District Heating & Cooling |
| Base Building - Common Areas | Total Energy |
| Base Building - Common Areas | Electricity |
| Base Building - Common Areas | Fuel |
| Base Building - Common Areas | District Heating & Cooling |
| Base Building - Shared Services | Total Energy |
| Base Building - Shared Services | Electricity |
| Base Building - Shared Services | Fuel |
| Base Building - Shared Services | District Heating & Cooling |
| Tenant Spaces (All) | Total Energy |
| Tenant Spaces (All) | Electricity |
| Tenant Spaces (All) | Fuel |
| Tenant Spaces (All) | District Heating & Cooling |
| Tenant Spaces - Landlord Controlled | Total Energy |
| Tenant Spaces - Landlord Controlled | Electricity |
| Tenant Spaces - Landlord Controlled | Fuel |
| Tenant Spaces - Landlord Controlled | District Heating & Cooling |
| Tenant Spaces - Tenant Controlled | Total Energy |
| Tenant Spaces - Tenant Controlled | Electricity |
| Tenant Spaces - Tenant Controlled | Fuel |
| Tenant Spaces - Tenant Controlled | District Heating & Cooling |
| Outdoor / Exterior / Parking (All) | Total Energy |
| Outdoor / Exterior / Parking - Landlord Controlled | Total Energy |
| Outdoor / Exterior / Parking - Tenant Controlled | Total Energy |
| EV Charging | Total Energy |
## Meter Assignments
To enable [space-based performance](/spaces/performance) tracking and [Scope 1, 2, and 3 emissions reporting](/performance/scope-emissions), energy meters must be assigned to their appropriate space types. All meters, regardless of whether they are in-metric or out-of-metric, can be assigned to space types.
[Click here](/meters/meter-space-assignments) to learn how to assign meters to spaces.
## Methodology
The diagram below shows how consumption data is rolled up from meters associated to a specific space type to calculate energy performance metrics.
The process is similar to that used for calculating whole building performance, except that it includes all meters assigned to the space type regardless of in-metric status.
-1.png?fit=max&auto=format&n=MAGBwHW7ghPLZnBo&q=85&s=e569697a7465cfbfbc0aee959a7b7f44) All meters assigned to a space type, including both **in-metric** and **out-of-metric** meters, are included when calculating performance metrics for that space type.
For aggregations across space-types (e.g. **Base Building**), all meters assigned to each component space type (e.g. **Common Areas, Shared Services**) are included.
Consumption entries between meter activation & deactivation dates and property buy and sell dates are broken down and reconstituted into monthly values for each meter. Data outside of these boundaries is ignored.
Consumption is aggregated into three main energy types: Electricity, Fuel and DH\&C to maintain consistency with data coverage tracking and reporting requirements.
| Meter Subtype | Energy Type |
| ---------------------- | ----------- |
| Electric | Electric |
| Electric on Site Solar | Electric |
| Electric on Site Wind | Electric |
| Natural Gas | Fuel |
| Diesel | Fuel |
| Fuel Oil No 1,2,4,5,6 | Fuel |
| District Steam | DH\&C |
| District Hot Water | DH\&C |
| District Chilled Water | DH\&C |
Monthly values are rolled up for each space and energy type to provide monthly & annual metrics for every possible 12-month reporting period.
## **Property Tracking**
**Navigate to Property → Spaces → Energy**
### Configure Settings
Using the bottoms located at the top-right, confirm all spaces and meter assignments.
* **Assign Meters:** [Click here](/meters/meter-space-assignments) to learn more.
* **Floor Areas:** [Click here](/spaces/data-coverage) to learn more.
* **Data Coverage (Landlord / Tenant):** [Click here](/spaces/data-coverage) to learn more.
* **Units**
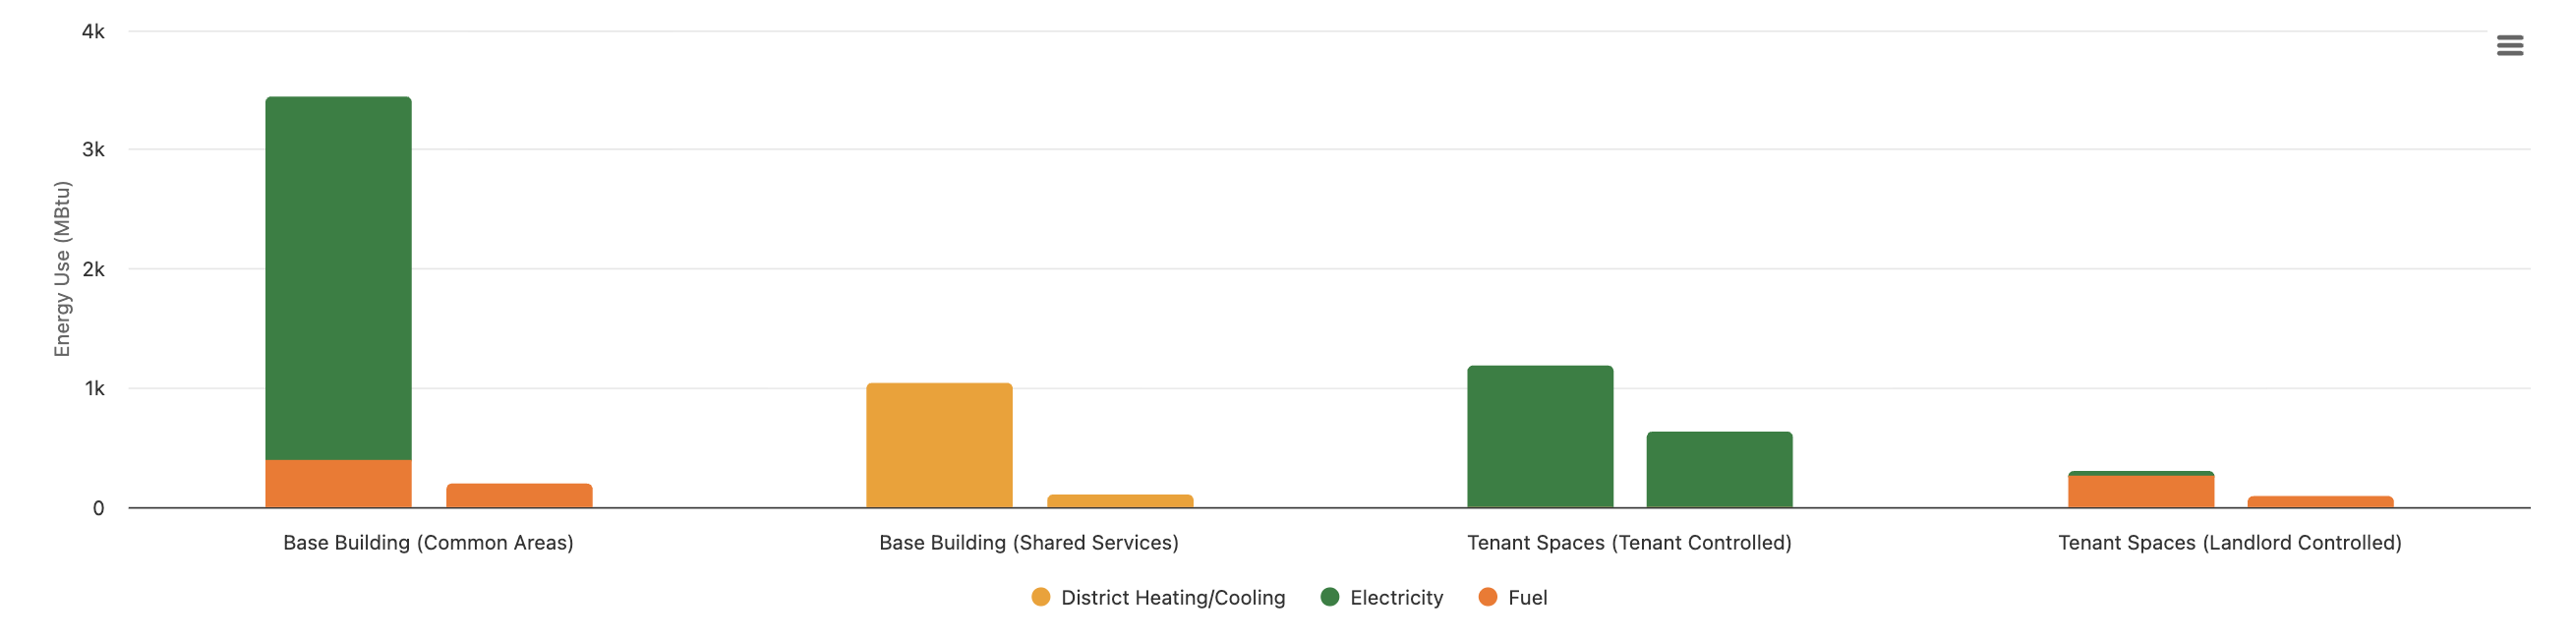
### Annual Energy Use by Space Type
Changes in energy use from the base period to the reporting period by space type, broken down by energy type.
All meters assigned to a space type, including both **in-metric** and **out-of-metric** meters, are included when calculating performance metrics for that space type.
For aggregations across space-types (e.g. **Base Building**), all meters assigned to each component space type (e.g. **Common Areas, Shared Services**) are included.
Consumption entries between meter activation & deactivation dates and property buy and sell dates are broken down and reconstituted into monthly values for each meter. Data outside of these boundaries is ignored.
Consumption is aggregated into three main energy types: Electricity, Fuel and DH\&C to maintain consistency with data coverage tracking and reporting requirements.
| Meter Subtype | Energy Type |
| ---------------------- | ----------- |
| Electric | Electric |
| Electric on Site Solar | Electric |
| Electric on Site Wind | Electric |
| Natural Gas | Fuel |
| Diesel | Fuel |
| Fuel Oil No 1,2,4,5,6 | Fuel |
| District Steam | DH\&C |
| District Hot Water | DH\&C |
| District Chilled Water | DH\&C |
Monthly values are rolled up for each space and energy type to provide monthly & annual metrics for every possible 12-month reporting period.
## **Property Tracking**
**Navigate to Property → Spaces → Energy**
### Configure Settings
Using the bottoms located at the top-right, confirm all spaces and meter assignments.
* **Assign Meters:** [Click here](/meters/meter-space-assignments) to learn more.
* **Floor Areas:** [Click here](/spaces/data-coverage) to learn more.
* **Data Coverage (Landlord / Tenant):** [Click here](/spaces/data-coverage) to learn more.
* **Units**
### Annual Energy Use by Space Type
Changes in energy use from the base period to the reporting period by space type, broken down by energy type.
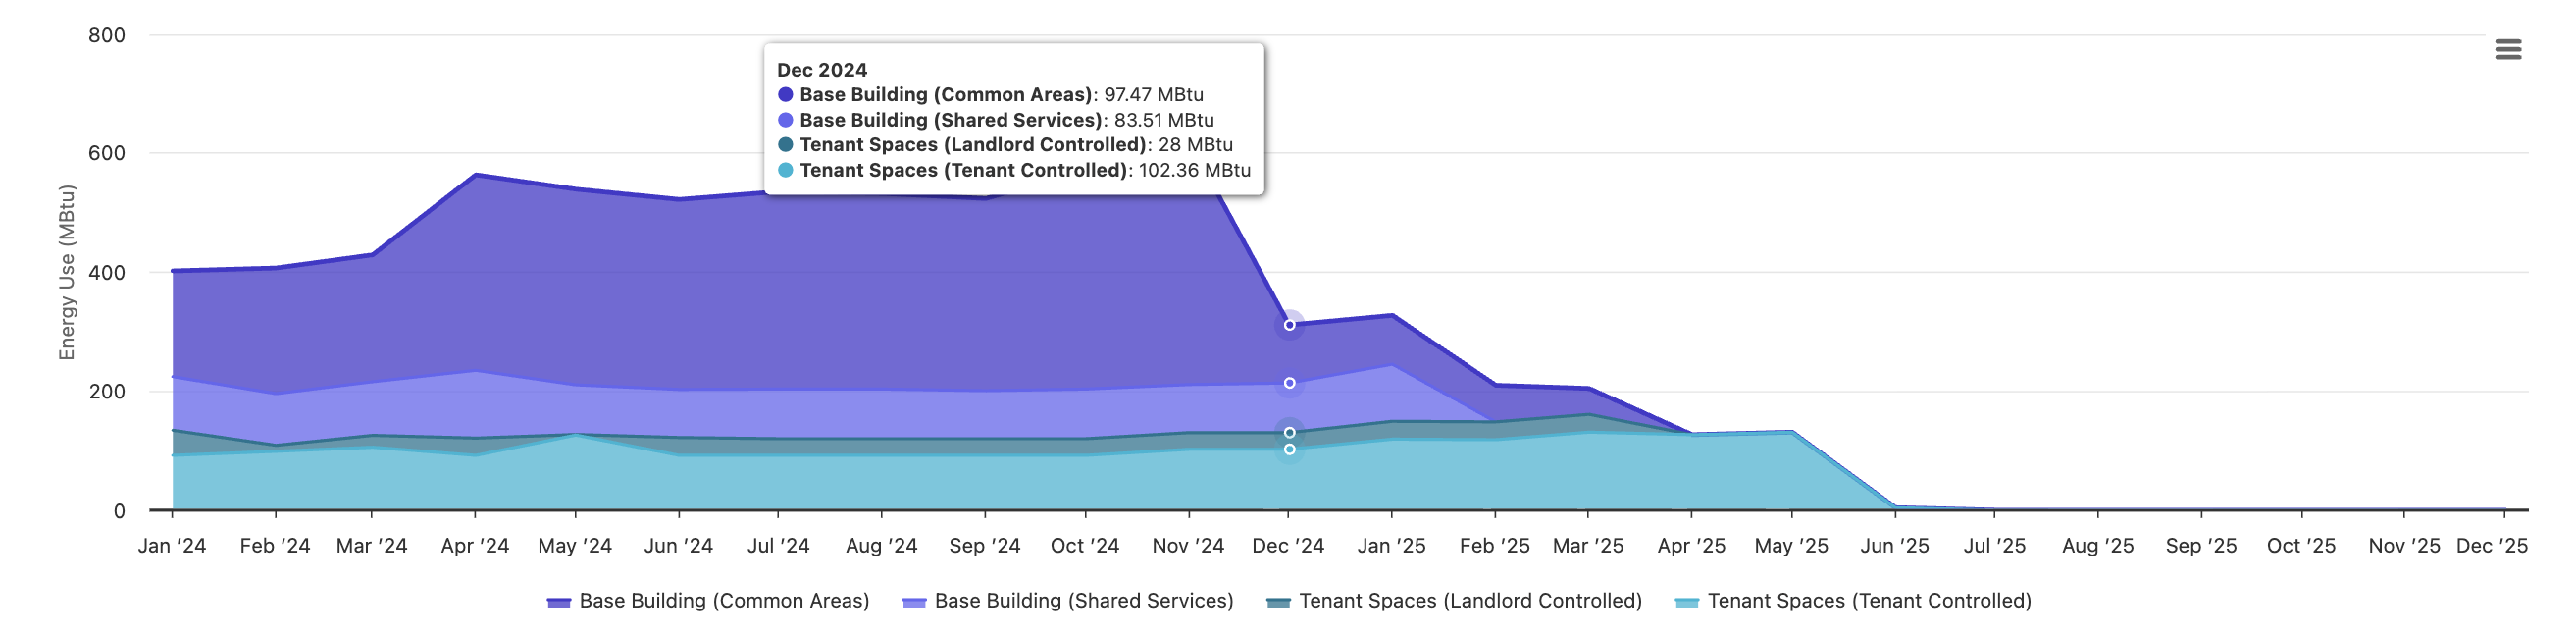
 ### Monthly Energy Use by Space Type
Monthly total energy use for each space type from the start of the base period to the end of the reporting period.
### Monthly Energy Use by Space Type
Monthly total energy use for each space type from the start of the base period to the end of the reporting period.
 ### Base Building Annual Energy Trends
Energy consumption, data completeness and coverage metrics for the base and reporting periods for **Base Building (All)**, **Common Areas** and **Shared Services** space types.
### Base Building Annual Energy Trends
Energy consumption, data completeness and coverage metrics for the base and reporting periods for **Base Building (All)**, **Common Areas** and **Shared Services** space types.
 ### Tenant Space Annual Energy Trends
Energy consumption, data completeness and coverage metrics for the base and reporting periods for **Tenant Spaces (All)**, **Tenant Spaces - Landlord Controlled** and **Tenant Spaces - Tenant Controlled** space types.
### Tenant Space Annual Energy Trends
Energy consumption, data completeness and coverage metrics for the base and reporting periods for **Tenant Spaces (All)**, **Tenant Spaces - Landlord Controlled** and **Tenant Spaces - Tenant Controlled** space types.
 ## **Portfolio Tracking**
**Navigate to Portfolio → Spaces → Energy**
### Configure Settings
Using the menu items, set the appropriate views
* **Base Period & Reporting Period**
* **Full Ownership**: *Include only properties that were owned over the entirety of base and reporting periods.*
* **Space type**
* **Energy type**
* **Usage or Cost:** *View consumption (usage) or cost metrics and trends across spaces.*
* **Units:** *kWh, MWh, kBtu, MBtu, therms*
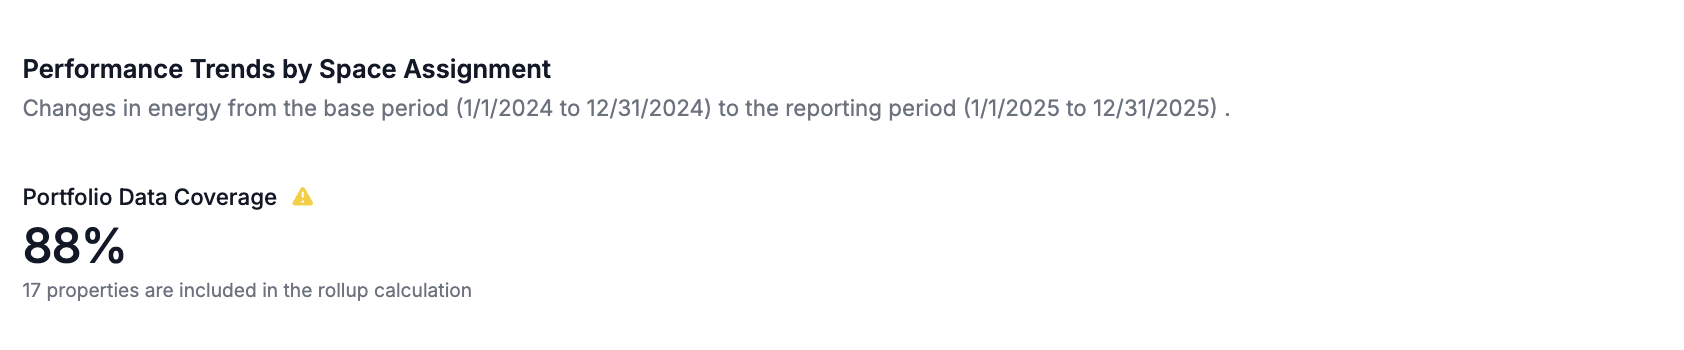
### Portfolio Data Coverage
* Above the table, a stat card displays the portfolio-level data coverage value for the selected space type and energy type over the reporting period.
* Calculated by dividing the sum of **Floor Area Coverage** values for the selected space and energy type across all properties by the sum of **Max Area Covered** values.
* A warning icon is displayed if any errors are identified for across data coverage entries.
## **Portfolio Tracking**
**Navigate to Portfolio → Spaces → Energy**
### Configure Settings
Using the menu items, set the appropriate views
* **Base Period & Reporting Period**
* **Full Ownership**: *Include only properties that were owned over the entirety of base and reporting periods.*
* **Space type**
* **Energy type**
* **Usage or Cost:** *View consumption (usage) or cost metrics and trends across spaces.*
* **Units:** *kWh, MWh, kBtu, MBtu, therms*
### Portfolio Data Coverage
* Above the table, a stat card displays the portfolio-level data coverage value for the selected space type and energy type over the reporting period.
* Calculated by dividing the sum of **Floor Area Coverage** values for the selected space and energy type across all properties by the sum of **Max Area Covered** values.
* A warning icon is displayed if any errors are identified for across data coverage entries.
 ### Performance Table
The table below hides properties by default for which the selected space type is explicitly marked by a user as not serviced by the energy type.
* **Property Name:** *Each row in the table is for a different property*
* **# of Meters:** *The number of meters assigned to the selected space type*
* **Data Coverage:** *The property-level data coverage over the reporting period.*
* **Base Period Data Completeness:** *The total data completeness over the base period across all meters of the selected energy type assigned to the selected space type.*
* **Base Period Consumption:** *The total consumption over the base period across all meters of the selected energy type assigned to the selected space type.*
* **Reporting Period Data Completeness:** *The total data completeness over the reporting period across all meters of the selected energy type assigned to the selected space type.*
* **Reporting Period Consumption:** *The total consumption over the reporting period across all meters of the selected energy type assigned to the selected space type.*
* **Annual % Difference:** *The percent difference in total consumption from the base period to the reporting period.*
### Performance Table
The table below hides properties by default for which the selected space type is explicitly marked by a user as not serviced by the energy type.
* **Property Name:** *Each row in the table is for a different property*
* **# of Meters:** *The number of meters assigned to the selected space type*
* **Data Coverage:** *The property-level data coverage over the reporting period.*
* **Base Period Data Completeness:** *The total data completeness over the base period across all meters of the selected energy type assigned to the selected space type.*
* **Base Period Consumption:** *The total consumption over the base period across all meters of the selected energy type assigned to the selected space type.*
* **Reporting Period Data Completeness:** *The total data completeness over the reporting period across all meters of the selected energy type assigned to the selected space type.*
* **Reporting Period Consumption:** *The total consumption over the reporting period across all meters of the selected energy type assigned to the selected space type.*
* **Annual % Difference:** *The percent difference in total consumption from the base period to the reporting period.*
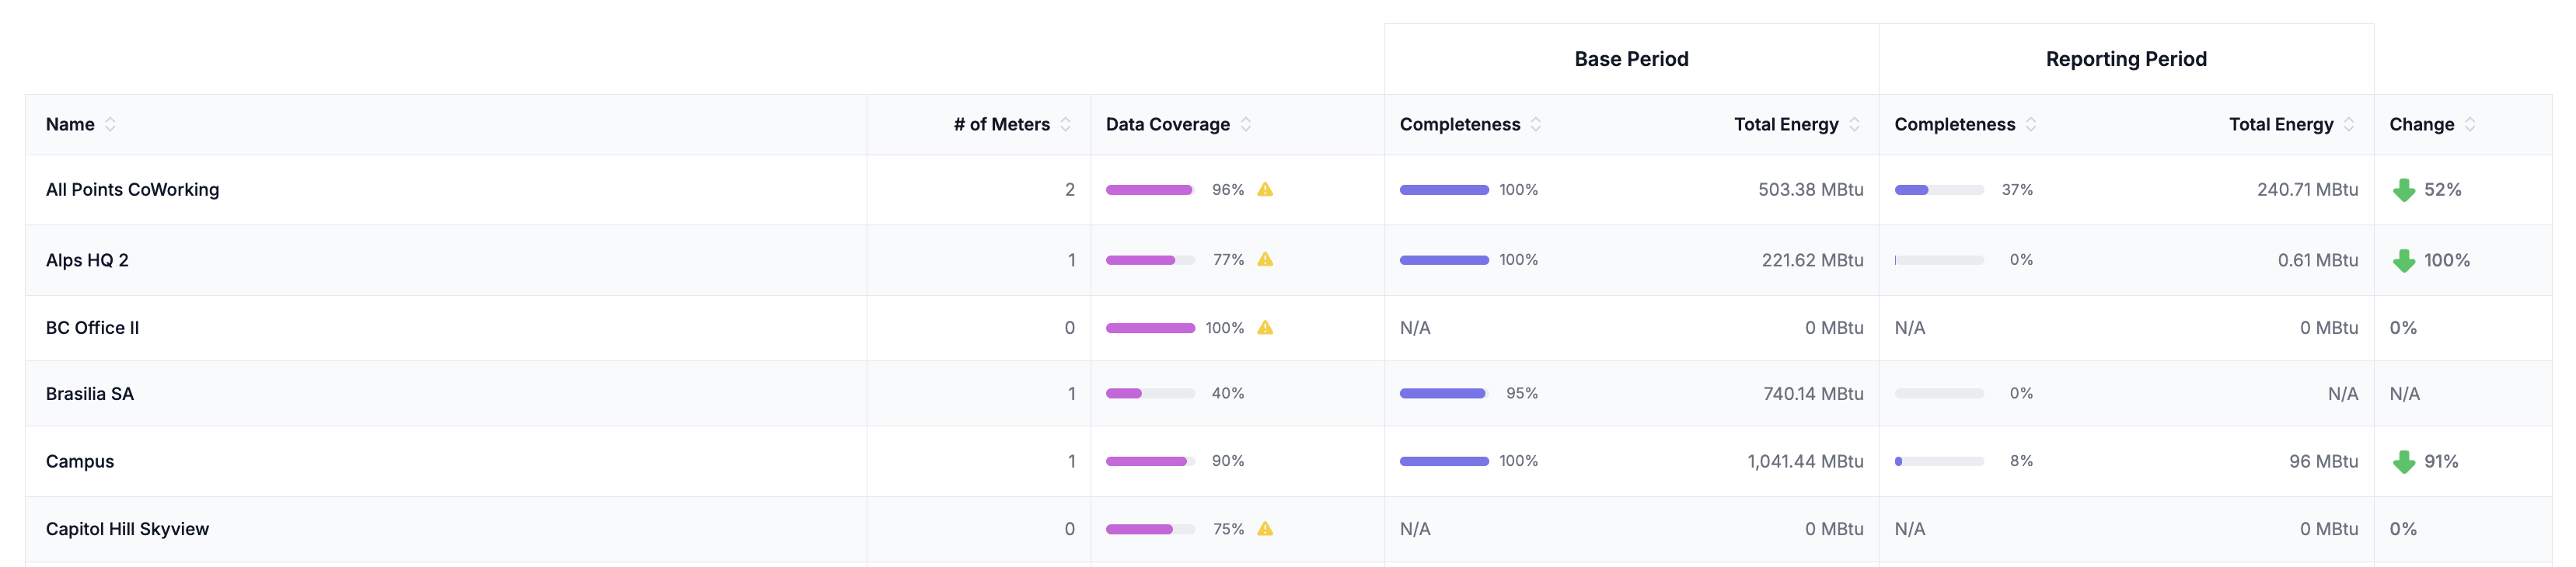 Sort the colums of the table to quickly identify performance and data coverage outliers across all properties.