> ## Documentation Index
> Fetch the complete documentation index at: https://docs.abisko.io/llms.txt
> Use this file to discover all available pages before exploring further.
# Overview
> An overview of space-based data and performance tracking
## Space Types
In addition to whole building performance metrics, users can track more granular performance trends across landlord, tenant, and exterior spaces. The ability to concurrently track whole building and space-based performance provides users with multiple contexts from which they can approach data management, reporting and decarbonization planning.
### Rollups & Combinations
Space-based performance, data completeness and data coverage metrics are calculated based on the meters assigned to each space type. Calculations are automatically updated for each space type whenever meters are added, updated, or reassigned, ensuring users always have access to the most current insights.
[Click here](/meters/meter-space-assignments) to learn how to assign meters to spaces.
Performance metrics are also provided for higher-level groupings of space types. The diagram below illustrates the space types for which performance metrics are calculated and how they are combined to provide higher-level insights.
 **Example:**
* Users can track performance separately for **Common Areas** and **Shared Services**
* Users can also report performance for **Base Building**, which represents the total combined spaces across **Common Areas** and **Shared Services**
## Performance Metrics
Space-based performance metrics are available at the property and portfolio levels and can be accessed from within the **Spaces** tab. The **Reports** tab also contains several comprehensive EXCEL reports that contain performance insights across meters, properties and portfolios.
Click on any of the topics below to jump to the section.
Tracking data coverage across landlord and tenant spaces.
Energy performance metrics & calculations across space types.
Emissions metrics & calculations across space types.
## EXCEL Reports
Export all energy and emissions performance metrics across all spaces to support external analysis.
**Navigate to Portfolio → Reports → Performance**
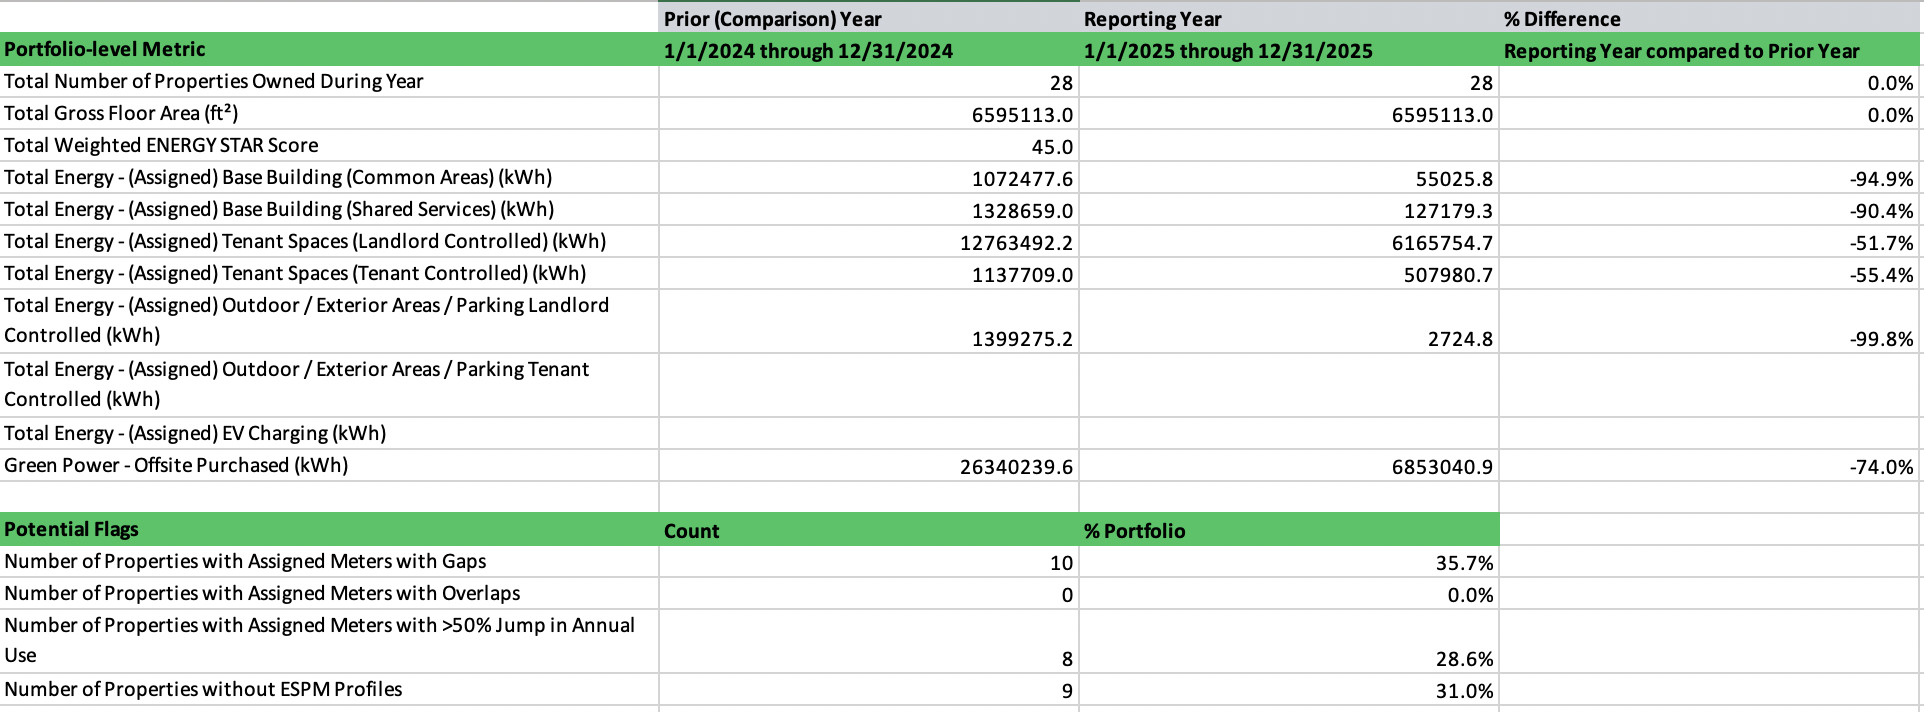
### **Landlord vs. Tenant Performance Report**
* This report includes all performance (e.g. consumption) and data quality (e.g. completeness, gaps, overlaps) metrics associated with space types for properties across the portfolio
* Space-based performance is reported across all properties, regardless of reporting levels or in-metric meters status.
**Example:**
* Users can track performance separately for **Common Areas** and **Shared Services**
* Users can also report performance for **Base Building**, which represents the total combined spaces across **Common Areas** and **Shared Services**
## Performance Metrics
Space-based performance metrics are available at the property and portfolio levels and can be accessed from within the **Spaces** tab. The **Reports** tab also contains several comprehensive EXCEL reports that contain performance insights across meters, properties and portfolios.
Click on any of the topics below to jump to the section.
Tracking data coverage across landlord and tenant spaces.
Energy performance metrics & calculations across space types.
Emissions metrics & calculations across space types.
## EXCEL Reports
Export all energy and emissions performance metrics across all spaces to support external analysis.
**Navigate to Portfolio → Reports → Performance**
### **Landlord vs. Tenant Performance Report**
* This report includes all performance (e.g. consumption) and data quality (e.g. completeness, gaps, overlaps) metrics associated with space types for properties across the portfolio
* Space-based performance is reported across all properties, regardless of reporting levels or in-metric meters status.