> ## Documentation Index
> Fetch the complete documentation index at: https://docs.abisko.io/llms.txt
> Use this file to discover all available pages before exploring further.
# Portfolio Performance & Data Quality Report
> A comprehensive view of meter, property and portfolio-level trends
**Navigate to Portfolio → Reports → Performance → 'Portfolio Performance & Data Quality' Report**
This report is based on **Whole Building** performance metrics, which are driven by all [**in-metric**](/meters/meter-status) meters associated with each property.
This Excel report is designed to support ESG reporting, investor disclosures and detailed performance analysis. Users can generate the report for multiple utility types, including:
* **Energy & Emissions**: Monthly & annual trends at the meter, property and portfolio-level.
* Broken down by energy type, location-based and market-based emissions
* **Water**: Monthly & annual trends at the meter, property and portfolio-level.
* **Waste**: Monthly & annual trends at the meter, property and portfolio-level.
* Broken down by waste and disposal types.
## About the Report
* **Reporting Period:** Monthly and annual performance trends and consumption values are provided for each meter, property, and portfolio for the selected reporting period, as well as for the preceding 12 months.
* **Properties:** This report includes all properties associated with the portfolio that were owned at any time during the selected 12-month reporting period.
* **Meters:** This report includes whole building performance and data quality metrics driven by all in-metric meters associated with the included properties.
## Performance Metrics & Trends
The following performance metrics are included in this report, along with supporting metrics (e.g., green power), at the meter, property, and portfolio levels where applicable.
| Energy & Emissions Report | Water Report | Waste Report |
| ------------------------------------------ | ------------------------- | --------------------- |
| Total Weighted ENERGY STAR Score | Total Water Use Intensity | Total Waste |
| Total Energy Use Intensity | Total Water | Landfill Waste |
| Total Energy | | Incineration Waste |
| Total Electricity | | Waste to Energy Waste |
| Total Green Power - Onsite | | Recycled Waste |
| Total Green Power - Offsite | | Donated/Reused Waste |
| Total Fuel | | Composted Waste |
| Total District & Heating | | Other Waste |
| Total (Location-Based) Emissions | | |
| Total (Location-Based) Emissions Intensity | | |
| Total (Market-Based) Emissions | | |
| Total (Market-Based) Emissions Intensity | | |
| Total Direct Emissions | | |
| Total Indirect (Location-Based) Emissions | | |
| Total Indirect (Market-Based) Emissions | | |
## EXCEL Tabs
The report is organized into multiple tabs that include monthly and annual trends across meters and properties, along with a portfolio-level summary.
### **Portfolio Trends (Annual)**
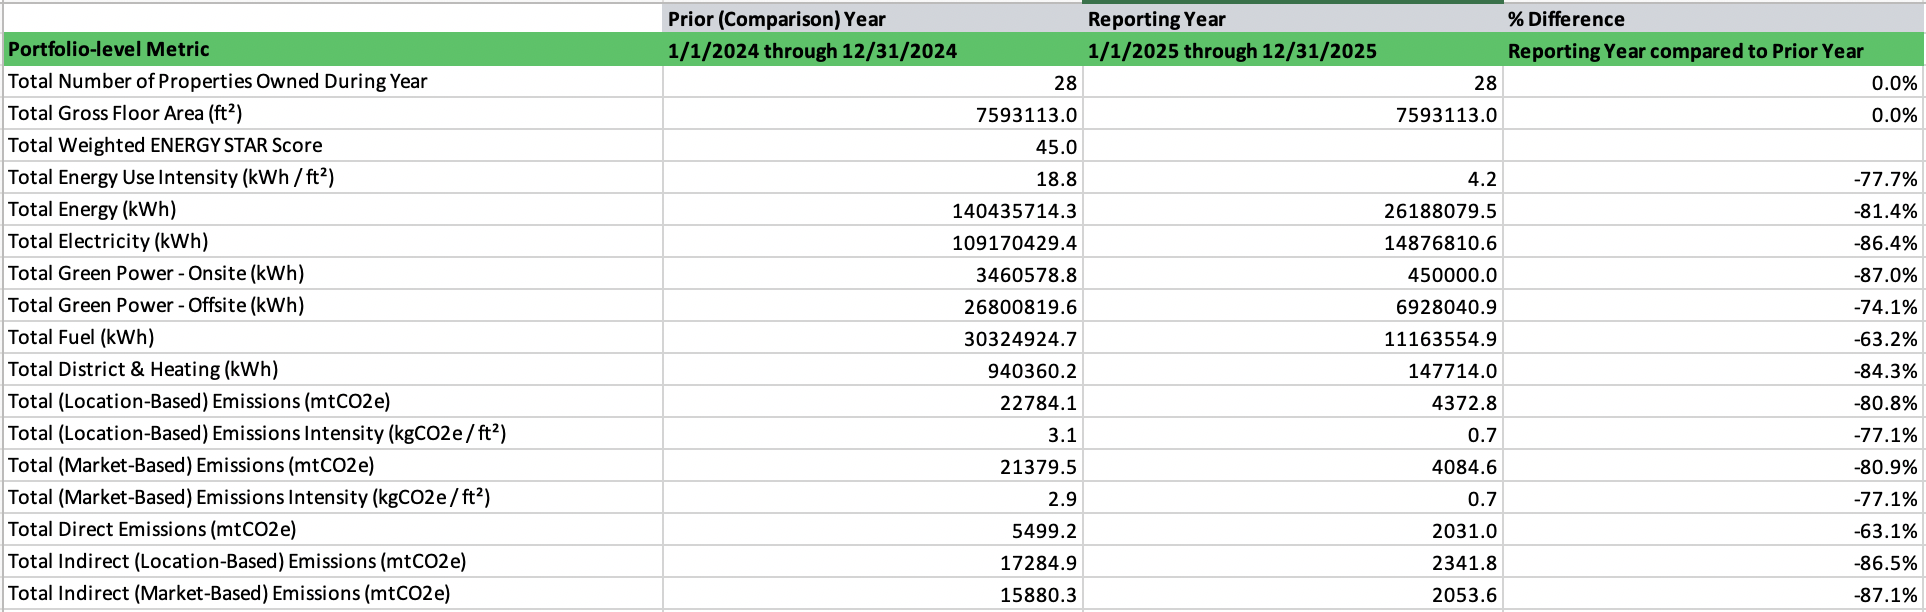
The **Portfolio Trends (Annual)** tab summarizes performance across the entire portfolio on an annual basis.
**What you’ll find:**
* Portfolio-level consumption aggregations
* Year-over-year performance trends broken down by energy, water and waste type
* Summary of properties with data quality issues.
 ***
### **Property Trends (Annual)**
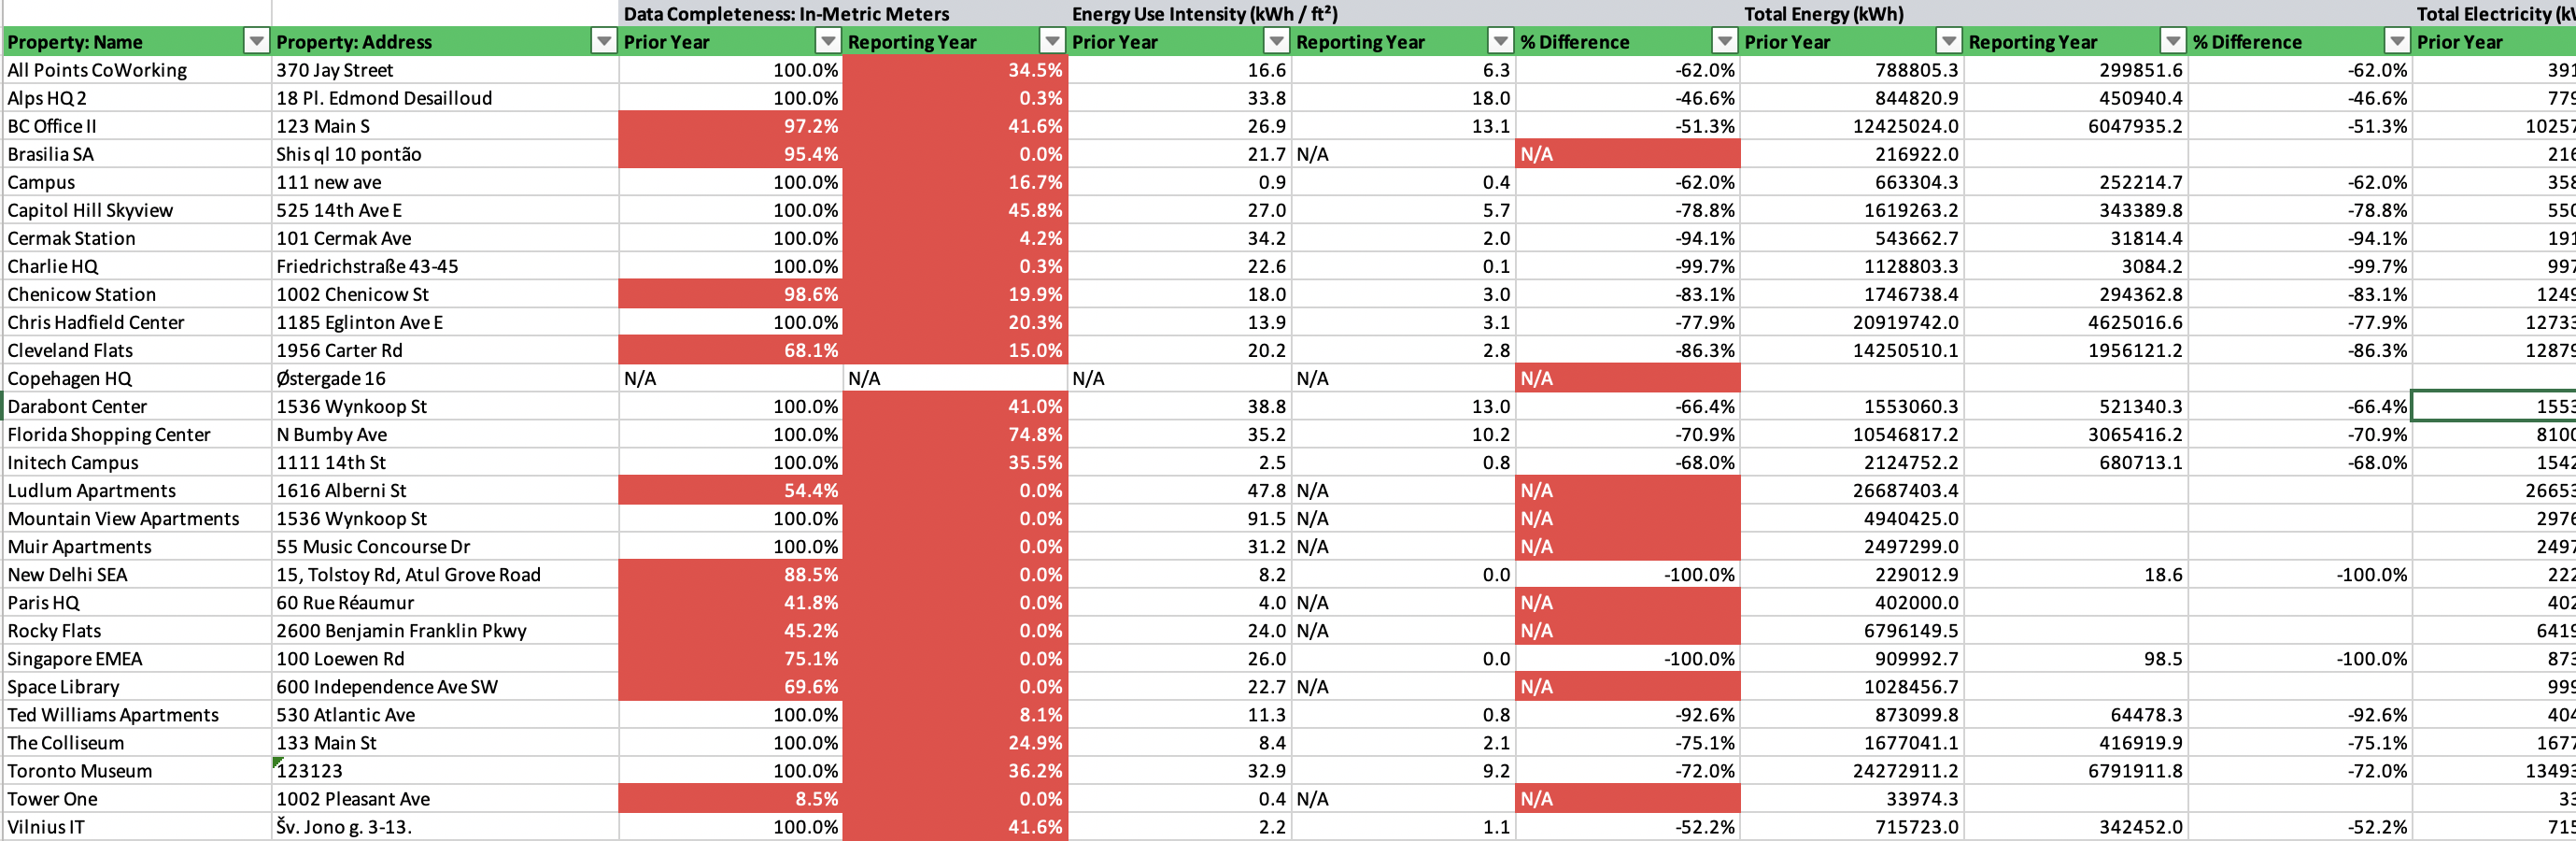
The **Property Trends (Annual)** tab shows annual performance and data quality metrics for each property in the portfolio.
**What you’ll find:**
* Property-level details
* Year-over-year performance trends broken down by energy, water and waste type
* Annual data quality metrics for each property
* Data Completeness (%)
* Number of meters with gaps
* Number of meters with overlaps
**Why it matters:**
This view helps identify high and low performing properties within the portfolio, potential performance anomalies and data quality issues across all properties.
***
### **Property Trends (Annual)**
The **Property Trends (Annual)** tab shows annual performance and data quality metrics for each property in the portfolio.
**What you’ll find:**
* Property-level details
* Year-over-year performance trends broken down by energy, water and waste type
* Annual data quality metrics for each property
* Data Completeness (%)
* Number of meters with gaps
* Number of meters with overlaps
**Why it matters:**
This view helps identify high and low performing properties within the portfolio, potential performance anomalies and data quality issues across all properties.
 ***
### **Property Trends (Monthly)**
The **Property Trends (Monthly)** tab provides month-by-month performance data for each property.
**What you’ll find:**
* Property-level details
* Month-over-month performance trends broken down by energy, water and waste type
* Trends over 24 consecutive months
**Why it matters:**
Monthly data enables users to identify seasonality, operational changes, and unusual performance patterns that may not be visible in annual summaries alone.
***
### **Meter Trends (Annual)**
The **Meter Trends (Annual)** tab presents annual performance data at the individual meter level.
**What you’ll find:**
* Meter-level details
* Activation periods, Date last updated, Meter type/subtype, Space assignment, etc.
* Year-over-year consumption trends for each meter
* Annual data quality metrics for each meter
* Data Completeness (%)
* Specific Gaps over 24-month period
* Specific Overlaps over 24-month period
***
### **Property Trends (Monthly)**
The **Property Trends (Monthly)** tab provides month-by-month performance data for each property.
**What you’ll find:**
* Property-level details
* Month-over-month performance trends broken down by energy, water and waste type
* Trends over 24 consecutive months
**Why it matters:**
Monthly data enables users to identify seasonality, operational changes, and unusual performance patterns that may not be visible in annual summaries alone.
***
### **Meter Trends (Annual)**
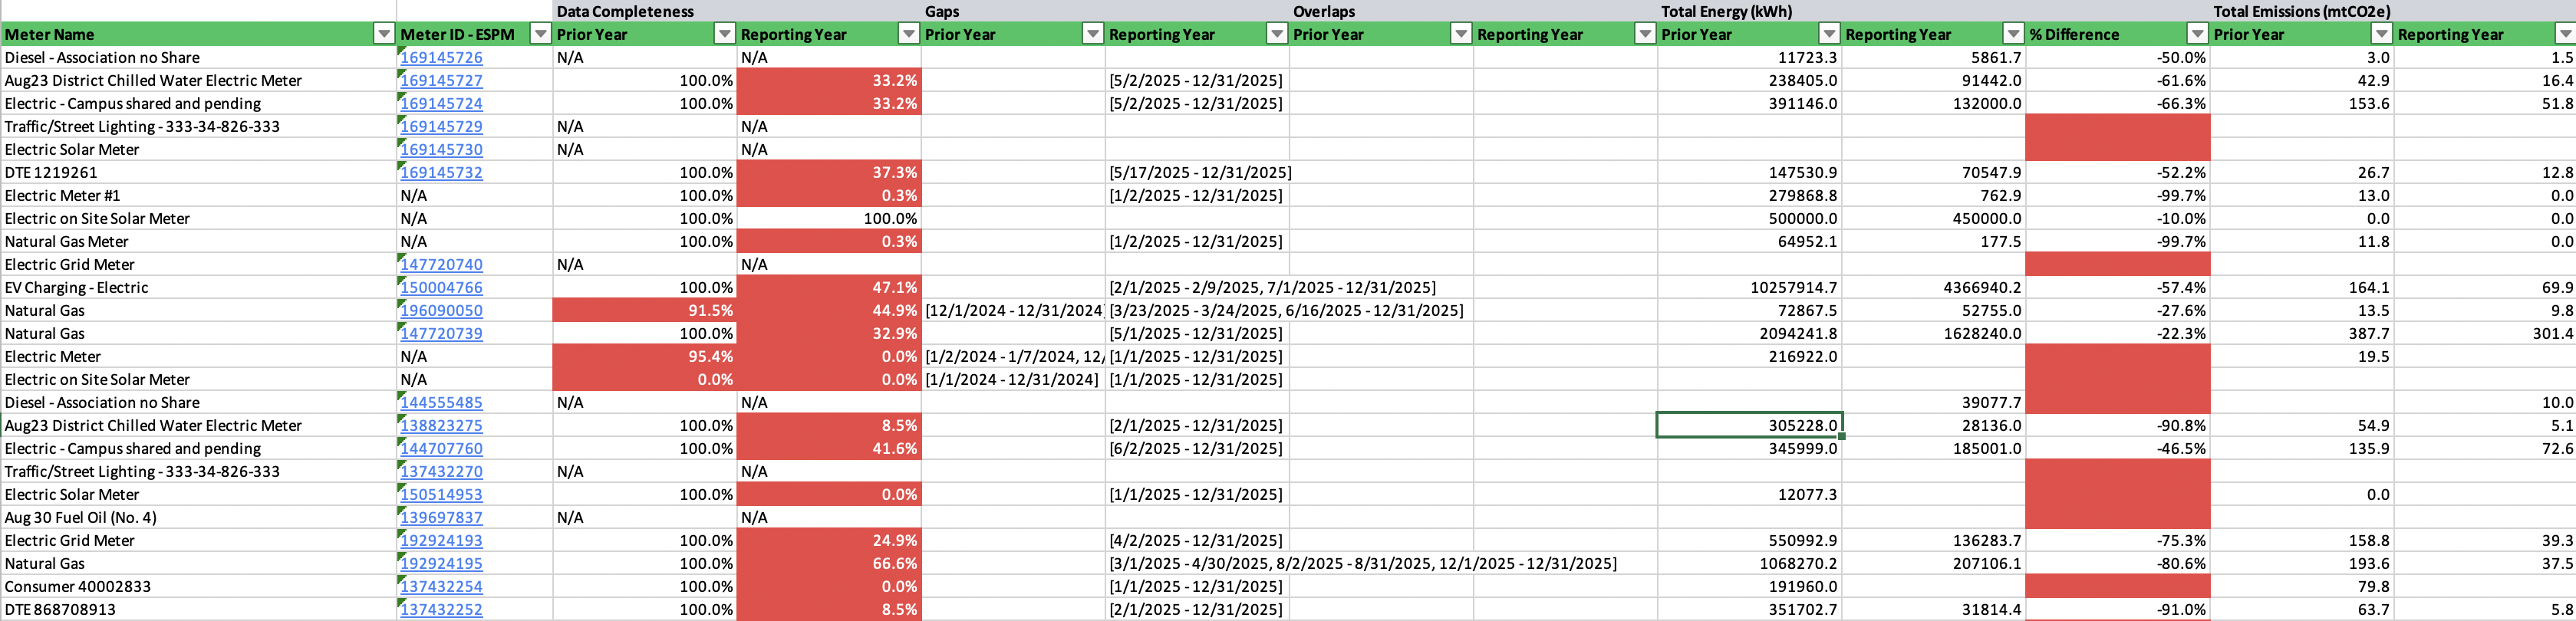
The **Meter Trends (Annual)** tab presents annual performance data at the individual meter level.
**What you’ll find:**
* Meter-level details
* Activation periods, Date last updated, Meter type/subtype, Space assignment, etc.
* Year-over-year consumption trends for each meter
* Annual data quality metrics for each meter
* Data Completeness (%)
* Specific Gaps over 24-month period
* Specific Overlaps over 24-month period
 **Why it matters:**
This tab provides transparency into how property and portfolio-level metrics are calculated from underlying meter data.
***
### **Meter Trends (Monthly)**
The **Meter Trends (Monthly)** tab shows detailed monthly data for individual meters.
**What you’ll find:**
* Meter-level details
* Activation periods, Date last updated, Meter type/subtype, Space assignment, etc.
* Month-over-month consumption trends for each meter
* Monthly data quality metrics for each meter
* Months with Jumps from Previous Year
* Data coverage events
**Why it matters:**
This level of detail supports deeper analysis, validation, and investigation of data anomalies, such as unexpected changes in consumption.
***
### **Reference Values**
The **Reference Values** tab is provided only for the **Energy & Emissions** report and contains the emissions factors applied for each meter and month for every property in the portfolio.
**Why it matters:**
Providing reference values improves transparency and supports emissions data auditing and reporting.
**Why it matters:**
This tab provides transparency into how property and portfolio-level metrics are calculated from underlying meter data.
***
### **Meter Trends (Monthly)**
The **Meter Trends (Monthly)** tab shows detailed monthly data for individual meters.
**What you’ll find:**
* Meter-level details
* Activation periods, Date last updated, Meter type/subtype, Space assignment, etc.
* Month-over-month consumption trends for each meter
* Monthly data quality metrics for each meter
* Months with Jumps from Previous Year
* Data coverage events
**Why it matters:**
This level of detail supports deeper analysis, validation, and investigation of data anomalies, such as unexpected changes in consumption.
***
### **Reference Values**
The **Reference Values** tab is provided only for the **Energy & Emissions** report and contains the emissions factors applied for each meter and month for every property in the portfolio.
**Why it matters:**
Providing reference values improves transparency and supports emissions data auditing and reporting.