> ## Documentation Index
> Fetch the complete documentation index at: https://docs.abisko.io/llms.txt
> Use this file to discover all available pages before exploring further.
# Landlord vs. Tenant Energy Report
> Energy trends across landlord and tenant spaces
**Navigate to Portfolio → Reports → Performance → 'Landlord vs. Tenant Energy' Report**
This report outputs energy use metrics associated with any space to which an energy meter is assigned (e.g. **Base Building**, **Tenant Spaces**, **Exterior/Outdoor/Parking**), independent of energy reporting level or in-metric meters status.
[Click here](/spaces/index) to learn how space-based performance metrics are calculated.
## About the Report
All meters should be assigned to their appropriate space type or excluded from analysis prior to generating this report to ensure accurate and complete metrics. [Click here](/meters/meter-space-assignments) to learn how.
* **Reporting Period:** Monthly and annual performance trends and consumption values are provided for each meter, property, and portfolio for the selected reporting period, as well as for the preceding 12 months.
* **Properties:** This report includes all properties associated with the portfolio that were owned at any time during the selected 12-month reporting period. Metrics are reported only for periods that fall within each property’s ownership period.
* **Meters:** All energy metrics are driven by consumption from all meters assigned to a [space type](/meters/meter-space-assignments), regardlesss of **Energy Reporting Level** or **in-metric** status.
## Metrics & Trends
The following performance metrics are included in this report for the portfolio and all properties, with consumption and emissions values additionally provided for meters.
| Metric |
| :------------------------------------------------------------------------------- |
| Total Energy - (Assigned) Base Building (Common Areas) |
| Total Energy - (Assigned) Base Building (Shared Services) |
| Total Energy - (Assigned) Tenant Spaces (Landlord Controlled) |
| Total Energy - (Assigned) Tenant Spaces (Tenant Controlled) |
| Total Energy - (Assigned) Outdoor / Exterior Areas / Parking Landlord Controlled |
| Total Energy - (Assigned) Outdoor / Exterior Areas / Parking Tenant Controlled |
| Total Energy - (Assigned) EV Charging (kWh) |
| Green Power - Offsite Purchased (kWh) |
## EXCEL Tabs
The report is organized into multiple tabs that include monthly and annual trends across meters and properties, along with a portfolio-level summary.
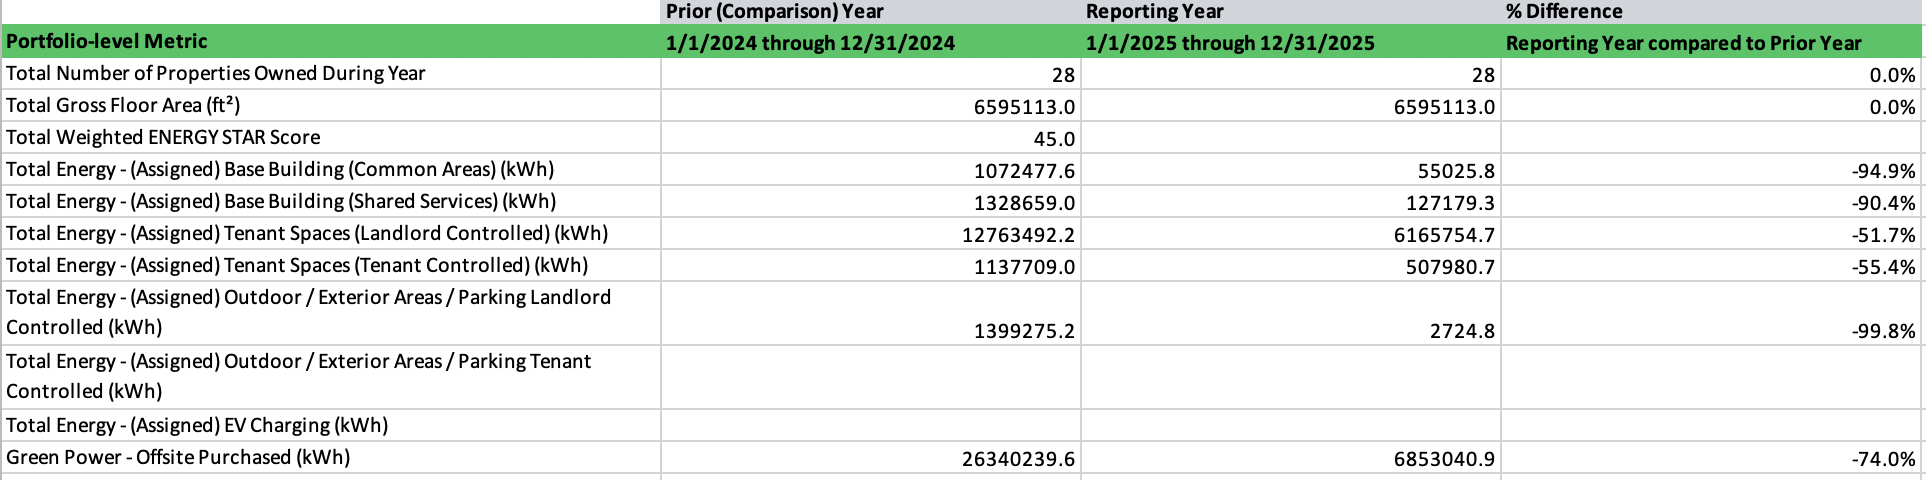
### **Portfolio Trends (Annual)**
The **Portfolio Trends (Annual)** tab summarizes energy trends across the entire portfolio.
**What you’ll find:**
* Annual energy use metrics for each building and exterior space type.
 ***
### **Property Trends (Annual)**
The **Property Trends (Annual)** tab shows annual energy use and data quality trends for each space type within each property in the portfolio.
**What you’ll find:**
* Property-level details
* Annual energy use metrics for each building and exterior space type.
* Annual data quality metrics for each property
* Data Completeness (%)
* Number of meters with identified gaps and overlaps.
**Why it matters:**
This view helps identify specific space types with high and low energy use across all properties.
***
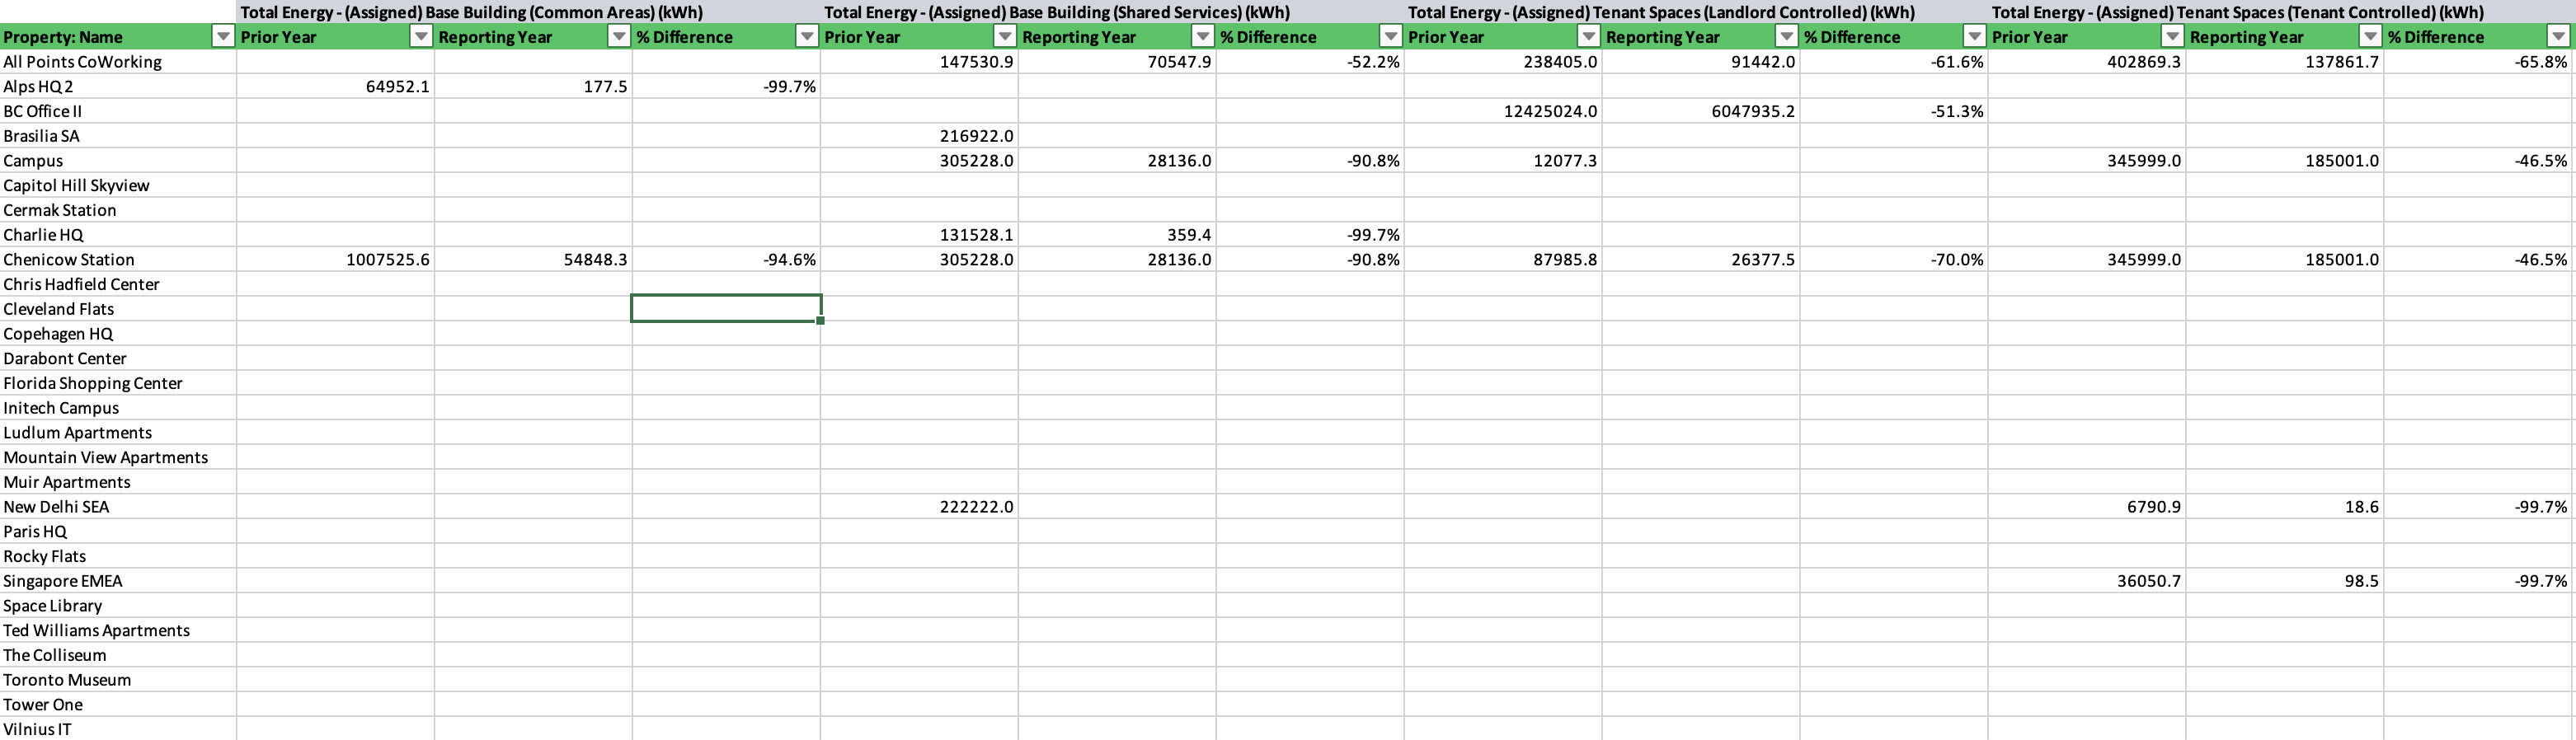
### **Property Trends (Annual)**
The **Property Trends (Annual)** tab shows annual energy use and data quality trends for each space type within each property in the portfolio.
**What you’ll find:**
* Property-level details
* Annual energy use metrics for each building and exterior space type.
* Annual data quality metrics for each property
* Data Completeness (%)
* Number of meters with identified gaps and overlaps.
**Why it matters:**
This view helps identify specific space types with high and low energy use across all properties.
 ***
### **Property Trends (Monthly)**
The **Property Trends (Monthly)** tab shows monthly energy use trends for each space type within each property in the portfolio.
**What you’ll find:**
* Property-level details
* Monthly energy use values for each building and exterior space type.
* Trends over 24 consecutive months
**Why it matters:**
Monthly data enables users to identify seasonality, operational changes, and unusual performance patterns that may not be visible in annual summaries alone.
***
### **Meter Trends (Annual)**
The **Meter Trends (Annual)** tab presents annual energy use and data quality metrics for every meter in every property across the portfolio.
**What you’ll find:**
* Property-level reference details
* Energy Reporting Level
* Meter-level details
* Activation periods, Meter type & subtype, Space assignment, Scope designation, etc.
* Year-over-year emissions trends for each meter
* Year-over-year Onsite Green Power trends for each meter
* Annual data quality metrics for each meter
* Data Completeness (%)
* Specific Gaps over 24-month period
* Specific Overlaps over 24-month period
**Why it matters:**
This tab provides transparency into how property and portfolio-level emissions are calculated from underlying meter data, taking into account the property **Energy Reporting Level**.
***
### **Reference Values**
The **Reference Values** tab contains the emissions factors applied for each meter and month for every property in the portfolio to support transparency, data auditing and reporting.
***
### **Property Trends (Monthly)**
The **Property Trends (Monthly)** tab shows monthly energy use trends for each space type within each property in the portfolio.
**What you’ll find:**
* Property-level details
* Monthly energy use values for each building and exterior space type.
* Trends over 24 consecutive months
**Why it matters:**
Monthly data enables users to identify seasonality, operational changes, and unusual performance patterns that may not be visible in annual summaries alone.
***
### **Meter Trends (Annual)**
The **Meter Trends (Annual)** tab presents annual energy use and data quality metrics for every meter in every property across the portfolio.
**What you’ll find:**
* Property-level reference details
* Energy Reporting Level
* Meter-level details
* Activation periods, Meter type & subtype, Space assignment, Scope designation, etc.
* Year-over-year emissions trends for each meter
* Year-over-year Onsite Green Power trends for each meter
* Annual data quality metrics for each meter
* Data Completeness (%)
* Specific Gaps over 24-month period
* Specific Overlaps over 24-month period
**Why it matters:**
This tab provides transparency into how property and portfolio-level emissions are calculated from underlying meter data, taking into account the property **Energy Reporting Level**.
***
### **Reference Values**
The **Reference Values** tab contains the emissions factors applied for each meter and month for every property in the portfolio to support transparency, data auditing and reporting.