> ## Documentation Index
> Fetch the complete documentation index at: https://docs.abisko.io/llms.txt
> Use this file to discover all available pages before exploring further.
# ESPM Gaps & Flags Report
> Identify anomalous values and trends based on ESPM metrics
**Navigate to Portfolio → Reports → ESPM → 'ESPM Gaps & Flags' Report**
This report is based on [ESPM Metrics](/espm/metrics) and [**in-metric**](/meters/meter-status) meters associated with each property.
This report identifies potentially anomalous property attributes, property performance metrics, meter configurations, and meter entries across the portfolio. Threshold parameters, which are used to detect potential anomalies, can be set by the user prior to report generation.
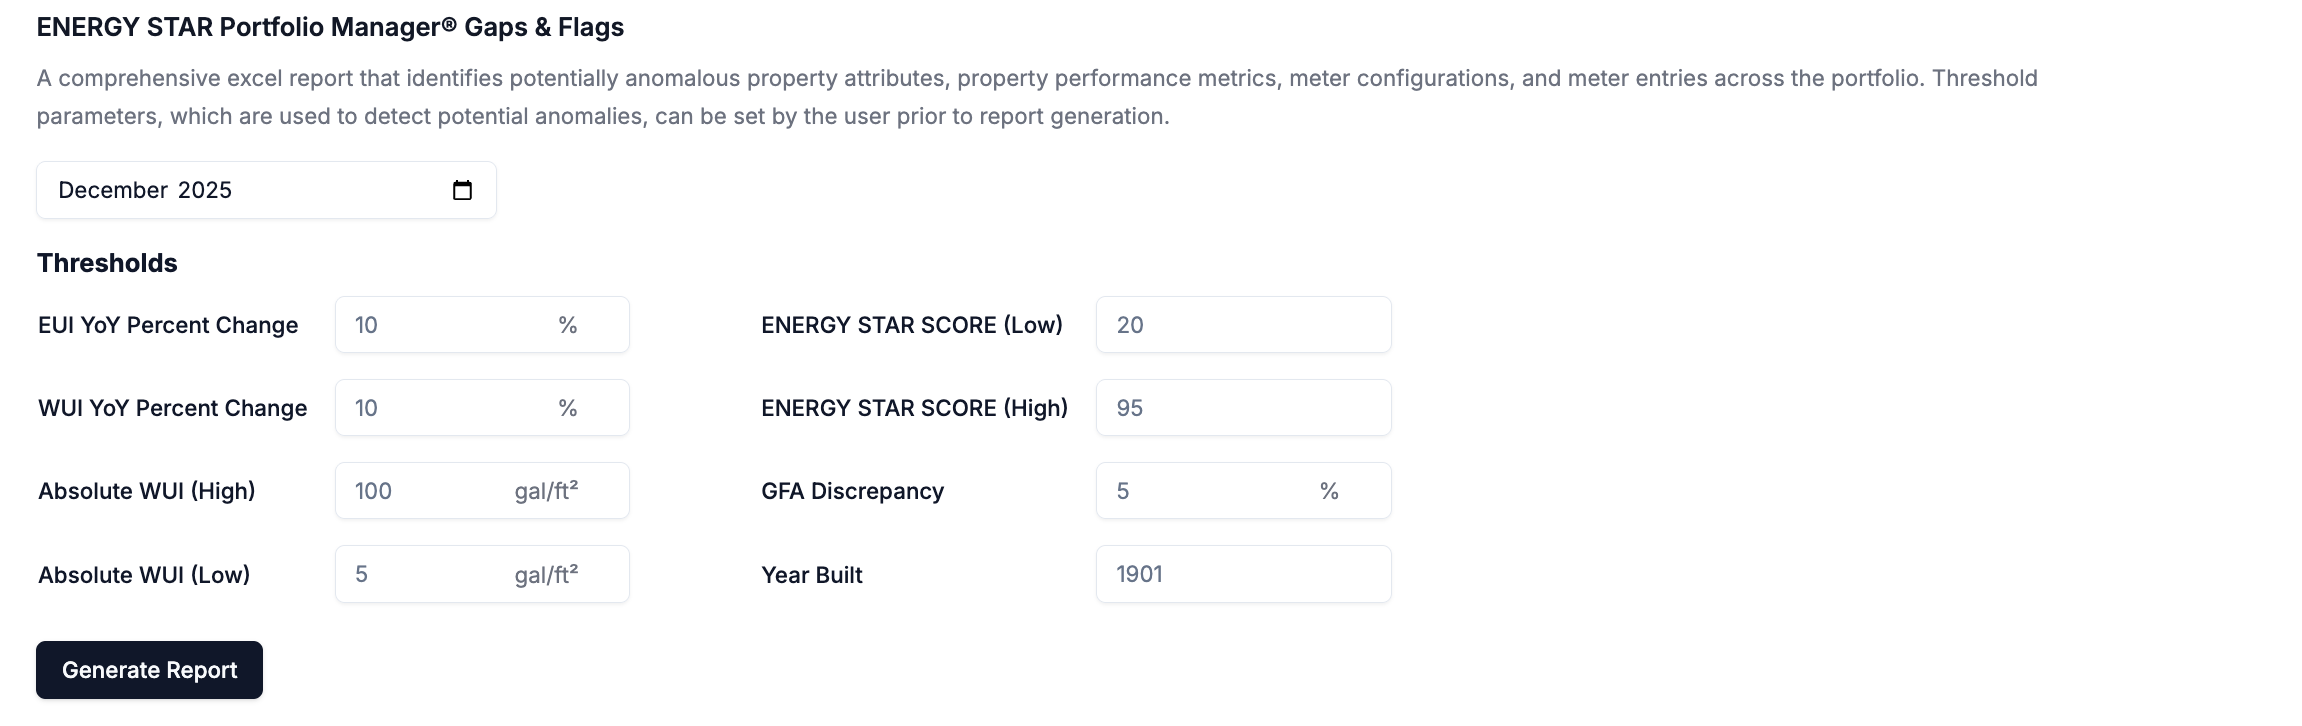 * User defined thresholds are used to flag anomalies in the report, which are highlighted in red.
## About the Report
* **Reporting Period:** Annual ESPM property metrics and meter consumption values are provided for the selected reporting period and the preceding year.
* **Properties:** This report includes all properties associated with the portfolio that were owned at any time during the selected 12-month reporting period.
* **Meters:** This report includes whole building performance and data quality metrics driven by all in-metric meters associated with the included properties.
* **Performance Metrics**: All performance metrics in the report reflect those reported by ESPM. These are often reported as N/A if there are any issues associated with data. [Learn more](/espm/metrics).
## EXCEL Tabs
The report is organized into multiple tabs.
### **Property Performance Flags**
This tab analyzes ESPM property performance metrics and includes the following checks:
| Category | Flag |
| -------- | ----------------------------- |
| Property | GFA Match (ESPM) |
| Property | Abnormal Year Built |
| Energy | High or Low ENERGY STAR Score |
| Energy | High or Low Site EUI |
| Energy | Anomalous YoY EUI % Change |
| Water | High or Low WUI |
| Water | YoY WUI % Change |
### **Property Coverage Flags**
This tab analyzes ESPM property performance metrics and includes the following checks:
| Category | Flag |
| -------- | ------------------------------------ |
| Energy | In-metric Meters with Gaps |
| Energy | In-metric Meters with Overlaps |
| Energy | Baseline Date |
| Energy | Data not up to date through \[Date] |
| Energy | No Meters included in Metrics |
| Energy | Meter Coverage ESPM |
| Energy | Active Meter Not Included in Metrics |
| Energy | Inactive Meter Included in Metrics |
| Water | In-metric Meters with Gaps |
| Water | In-metric Meters with Overlaps |
| Water | Baseline Date |
| Water | Data not up to date through \[Date] |
| Water | Data Completess (%) |
| Waste | Data not up to date through \[Date] |
### **Energy Meter Flags**
This tab analyzes ESPM meter-level consumption and trends and includes the following checks:
| **Meter-level Flags & Checks** |
| :----------------------------------------- |
| Available Days |
| # of Gap Days |
| Data Completeness |
| Gaps |
| Overlaps |
| Meter Has No Entries Flag |
| Active Meter Not Current Flag (12/31/2025) |
| Entry Before Start Date Flag |
| Entry After Deactivation Date Flag |
| Active Meter Not in Metrics Flag |
| Inactive Meter in Metrics Flag |
### **Water Meter Flags**
This tab analyzes ESPM meter-level consumption and trends and includes the following checks:
| **Meter-level Flags & Checks** |
| :----------------------------------------- |
| Available Days |
| # of Gap Days |
| Data Completeness |
| Gaps |
| Overlaps |
| Meter Has No Entries Flag |
| Active Meter Not Current Flag (12/31/2025) |
| Entry Before Start Date Flag |
| Entry After Deactivation Date Flag |
| Active Meter Not in Metrics Flag |
| Inactive Meter in Metrics Flag |
### **Waste Meter Flags**
This tab analyzes ESPM meter-level consumption and trends and includes the following checks:
| **Meter-level Flags & Checks** |
| :----------------------------------------- |
| Meter Has No Entries Flag |
| Active Meter Not Current Flag (12/31/2025) |
| Entry Before Start Date Flag |
| Entry After Deactivation Date Flag |
| Active Meter Not in Metrics Flag |
| Inactive Meter in Metrics Flag |
* User defined thresholds are used to flag anomalies in the report, which are highlighted in red.
## About the Report
* **Reporting Period:** Annual ESPM property metrics and meter consumption values are provided for the selected reporting period and the preceding year.
* **Properties:** This report includes all properties associated with the portfolio that were owned at any time during the selected 12-month reporting period.
* **Meters:** This report includes whole building performance and data quality metrics driven by all in-metric meters associated with the included properties.
* **Performance Metrics**: All performance metrics in the report reflect those reported by ESPM. These are often reported as N/A if there are any issues associated with data. [Learn more](/espm/metrics).
## EXCEL Tabs
The report is organized into multiple tabs.
### **Property Performance Flags**
This tab analyzes ESPM property performance metrics and includes the following checks:
| Category | Flag |
| -------- | ----------------------------- |
| Property | GFA Match (ESPM) |
| Property | Abnormal Year Built |
| Energy | High or Low ENERGY STAR Score |
| Energy | High or Low Site EUI |
| Energy | Anomalous YoY EUI % Change |
| Water | High or Low WUI |
| Water | YoY WUI % Change |
### **Property Coverage Flags**
This tab analyzes ESPM property performance metrics and includes the following checks:
| Category | Flag |
| -------- | ------------------------------------ |
| Energy | In-metric Meters with Gaps |
| Energy | In-metric Meters with Overlaps |
| Energy | Baseline Date |
| Energy | Data not up to date through \[Date] |
| Energy | No Meters included in Metrics |
| Energy | Meter Coverage ESPM |
| Energy | Active Meter Not Included in Metrics |
| Energy | Inactive Meter Included in Metrics |
| Water | In-metric Meters with Gaps |
| Water | In-metric Meters with Overlaps |
| Water | Baseline Date |
| Water | Data not up to date through \[Date] |
| Water | Data Completess (%) |
| Waste | Data not up to date through \[Date] |
### **Energy Meter Flags**
This tab analyzes ESPM meter-level consumption and trends and includes the following checks:
| **Meter-level Flags & Checks** |
| :----------------------------------------- |
| Available Days |
| # of Gap Days |
| Data Completeness |
| Gaps |
| Overlaps |
| Meter Has No Entries Flag |
| Active Meter Not Current Flag (12/31/2025) |
| Entry Before Start Date Flag |
| Entry After Deactivation Date Flag |
| Active Meter Not in Metrics Flag |
| Inactive Meter in Metrics Flag |
### **Water Meter Flags**
This tab analyzes ESPM meter-level consumption and trends and includes the following checks:
| **Meter-level Flags & Checks** |
| :----------------------------------------- |
| Available Days |
| # of Gap Days |
| Data Completeness |
| Gaps |
| Overlaps |
| Meter Has No Entries Flag |
| Active Meter Not Current Flag (12/31/2025) |
| Entry Before Start Date Flag |
| Entry After Deactivation Date Flag |
| Active Meter Not in Metrics Flag |
| Inactive Meter in Metrics Flag |
### **Waste Meter Flags**
This tab analyzes ESPM meter-level consumption and trends and includes the following checks:
| **Meter-level Flags & Checks** |
| :----------------------------------------- |
| Meter Has No Entries Flag |
| Active Meter Not Current Flag (12/31/2025) |
| Entry Before Start Date Flag |
| Entry After Deactivation Date Flag |
| Active Meter Not in Metrics Flag |
| Inactive Meter in Metrics Flag |