> ## Documentation Index
> Fetch the complete documentation index at: https://docs.abisko.io/llms.txt
> Use this file to discover all available pages before exploring further.
# Data Availability
> Period for which consumption data was collected and reported.
## Data Availability
An asset can have multiple utility types and data sources, for which data completeness can differ significantly. In these cases, the **Data Availability** must be determined based on the property's ownership period, construction status and the overlapping timeframe for which actual meter data is available.
**Example**: An asset has four meters, two of which have 12 months of data coverage, one has eight months of coverage from January to September, and another has five months from January to June. In this case, the **Data Availability** period should be based on the overlapping period across meters, which is five months.
### Methodology
The platform automatically calculates **Data Availability** by identifying the first and last valid data entries for all relevant meters that overlap with both the reporting period and each meter’s activation period. These dates establish the availability boundaries for each meter within the reporting period, while allowing any gaps between them to be addressed in accordance with GRESB gap-filling guidelines.
After calculating availability boundaries for each meter individually, overall **Data Availability** is determined based on the widest combined coverage across meters, accounting for a property's ownership periods and construction status.
To maximize **Data Availability**, users can follow these steps:
1. Generate an Abisko [GRESB Audit Report](/reports/gresb-audit) to identify meter data gaps, overlaps, and jumps
2. Address data quality issues by updating meter data
3. Remove space assignments for meters with persistently low data completeness
4. Adjust data coverage values for spaces impacted by meter changes
5. Repeat as necessary
### Custom Values
Abisko calculates **Data Availability** in strict accordance with GRESB guidelines. However, cases can arise in which it is practical to override calculations with custom values.
**Case 1**: A property has multiple meters with full data and only one with data missing for one month, causing an end gap.
* Overall property data completeness is very high and data availability may be adjusted to represent the full year from \[1/1 - 11/30] to \[1/1 - 12/31].
**Case 2 (Gap Fill)**: All meters in a property are missing data for the last month of the reporting year.
* Data availability may be adjusted to represent the full year from \[1/1 - 11/30] to \[1/1 - 12/31] and then users can select to fill the gap for the final month.
Gap-filling is restricted to the data availability period. In order to fill end gaps, users should extend the data availability period by setting custom values.
***
## Data Availability Algorithm
The following algorithm is used to determine the energy and water data availability across meters.
A property's operational data boundaries depend on its ownership period and construction status. If a property reports a **New Construction** or **Major Renovation** project with a start or end date within the reporting period, then the data availability is limited to the period over for which the property is owned and not under construction or major renovation.
Users can report data outside of a property's ownership period if it is transacted during the reporting period. To do this, the property's **date bought** or **date sold** should be removed and the property's NC\&MR status should be set as **Standing Investment**. This will configure the ALS to include performance data for the whole reporting period.
**IF** *property date\_bought > December 31 OR date\_sold \< January 1*:
* reporting\_start == N/A
* reporting\_end == N/A
**ELSE:**
* reporting\_start\_limit = MAX\[Jan 1, date\_bought, new\_construction\_reporting\_period\_end\_date, major\_renovation\_reporting\_period\_end\_date]
* reporting\_end\_limit = MIN\[Dec 31, date\_sold, major\_renovation\_reporting\_period\_start\_date]
If Reporting Level is Whole Building, get all in-metric meters. If Split, get all meters assigned to landlord and tenant spaces. If no meters meet criteria, then **availability\_period** = N/A.
* Activation Date is NOT null && Activation Date \< reporting\_end\_limit
* Deactivation Date is null OR Deactivation Date > reporting\_start\_limit
*For each meter, get meter\_start and meter\_end limits:*
* meter\_start\_limit = MAX(reporting\_start\_limit, activation\_date)
* meter\_end\_limit = MIN(reporting\_end\_limit, deactivation\_date)
*Iterate through all meter entries and update boundary limits:*
* meter\_entry\_start = start\_date of the oldest entry for which:
* entry\_end\_date > meter\_start\_limit && entry\_end\_date \< meter\_end\_limit
* meter\_entry\_end = end\_date of the most recent entry for which:
* entry\_start\_date > meter\_start\_limit && entry\_start\_date \< meter\_end\_limit
*Update meter-level availability periods*
* **IF meter\_entry\_start is NULL OR meter\_entry\_end is NULL]:**
* reporting\_start == reporting\_end == N/A
* **ELSE:**
* meter\_start = MAX(*reporting\_start\_limit*, *meter\_entry\_start)*
* meter\_start = MIN(*reporting\_end\_limit*, *meter\_entry\_end)*
* reporting\_start = MAX(*meter\_start* from all meters)
* reporting\_end = MIN(*meter\_end* from all meters)
***
## Viewing & Setting Data Availability
Data Availability can be viewed at the property and portfolio levels. However, custom values can only be set at the property level.
### Property Level
**Navigate to Property → GRESB → Meters**
The **Data Availability** for the GRESB Reporting Year and Prior Year is shown at the top of the page. Values are calculated based on the meters that are associated with the reported building spaces and are automatically updated as space assignments change.
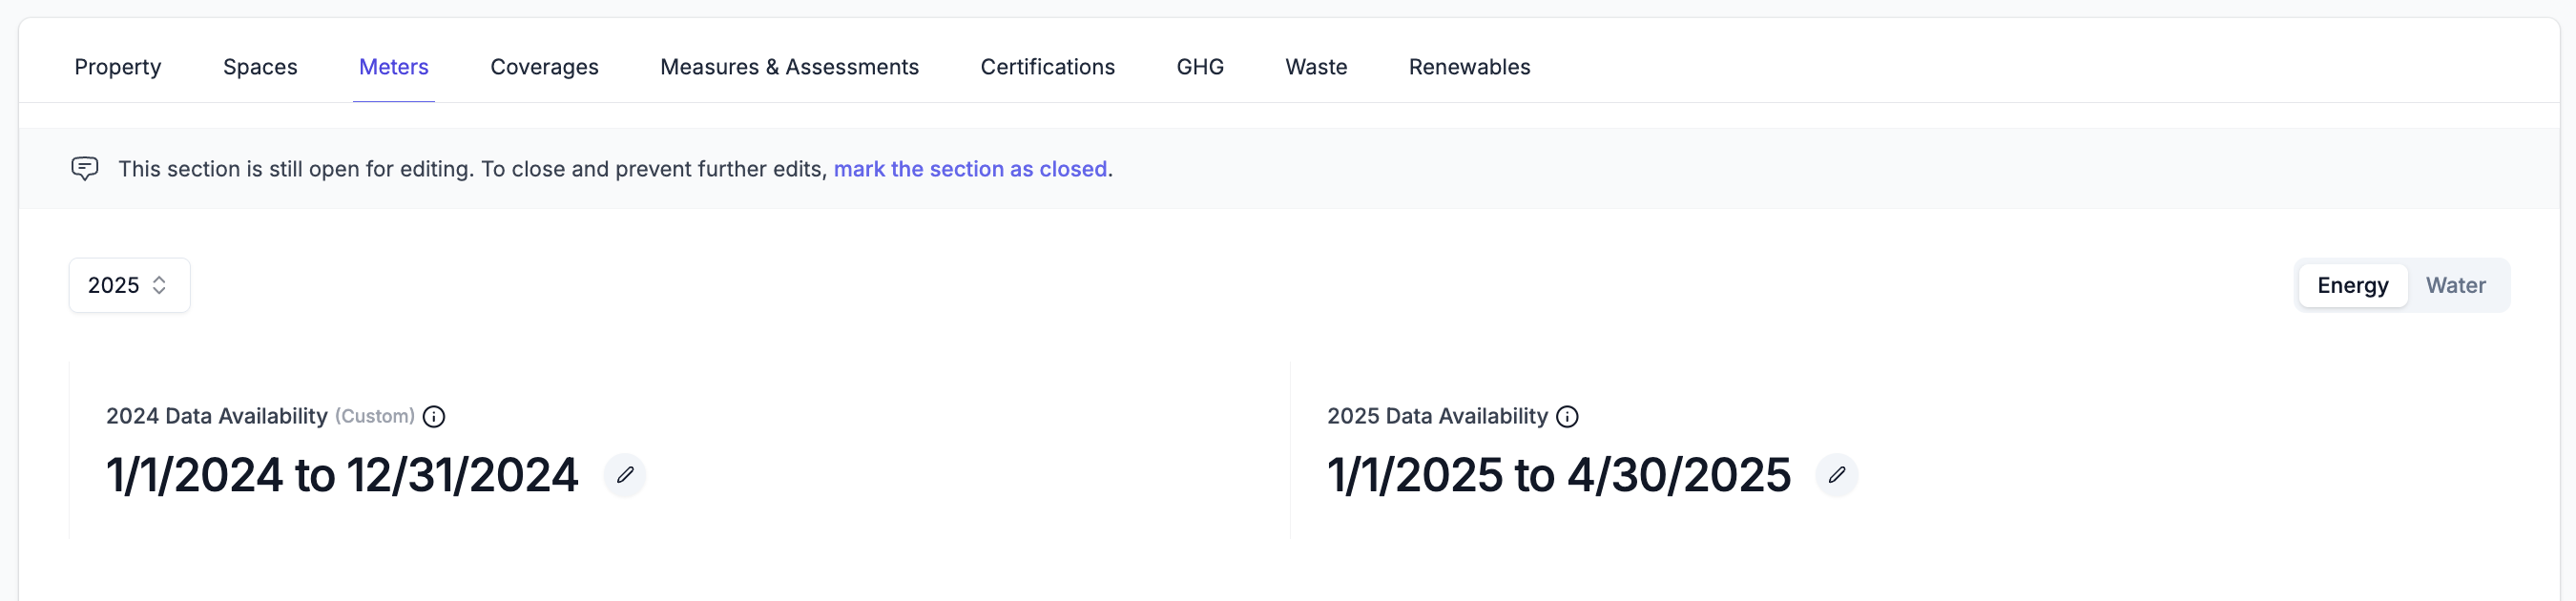 **To set a custom value:**
* Click on the edit icon next to the **Data Availability** dates for the year that you want to override.
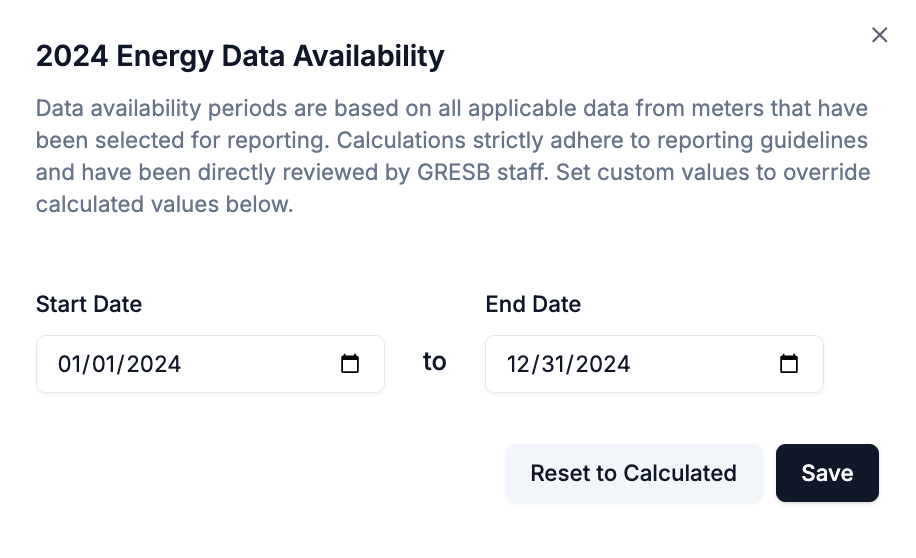
* In the sidebar, enter custom start and end dates and then click **Save.**
**To clear custom values**:
* In the sidebar, click the **Reset to Calculated** button to reset the start and end dates to calculated values.
**To set a custom value:**
* Click on the edit icon next to the **Data Availability** dates for the year that you want to override.
* In the sidebar, enter custom start and end dates and then click **Save.**
**To clear custom values**:
* In the sidebar, click the **Reset to Calculated** button to reset the start and end dates to calculated values.
 ### Portfolio Level
**Navigate to Property → GRESB → Meters**
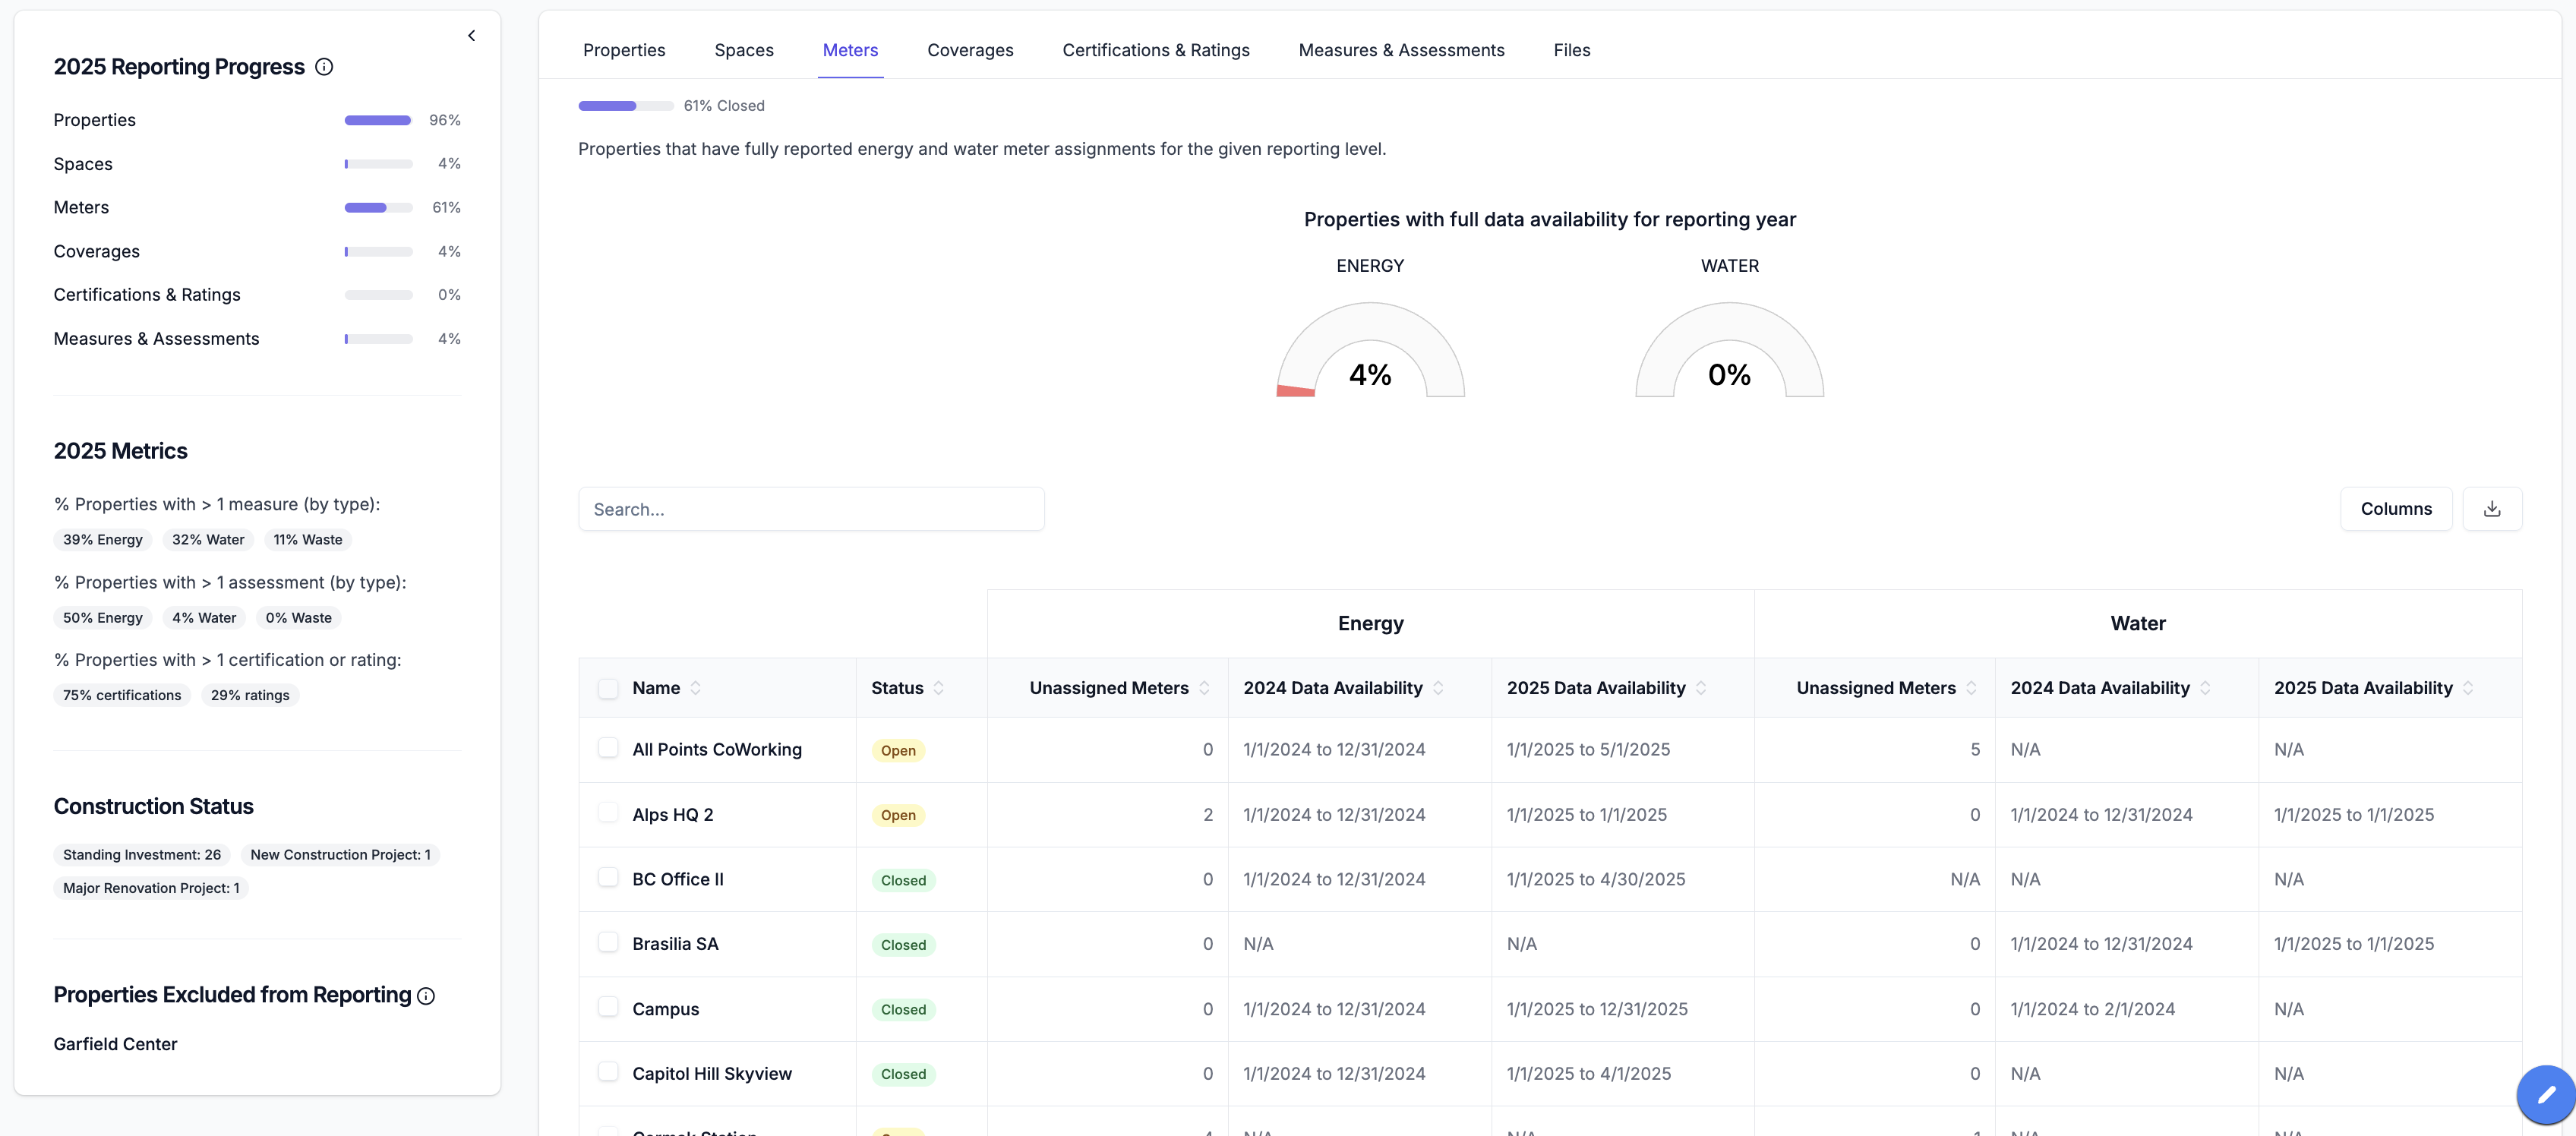
At the portfolio level, users can view the **Data Availability** values for every property across the portfolio for the GRESB Reporting Year and Prior Year.
* Users can easily identify properties with less than 12-months of Data Availability
### Portfolio Level
**Navigate to Property → GRESB → Meters**
At the portfolio level, users can view the **Data Availability** values for every property across the portfolio for the GRESB Reporting Year and Prior Year.
* Users can easily identify properties with less than 12-months of Data Availability