> ## Documentation Index
> Fetch the complete documentation index at: https://docs.abisko.io/llms.txt
> Use this file to discover all available pages before exploring further.
# Interacting with Tables & Plots
> Interact with tables and plots and download local data.
## Configure Table Columns
Users can configure tables to display specific data, sort columns to analyze trends, and download data for external analysis.
### **Add or remove table columns**
* Click on the **Columns** button located above the table on the right.
* Select the columns to hide or display in the table by clicking on the field names.
Some tables, like the one in the in the Portfolio Dashboard tab (below), also allow users to search for specific values in each column.
 ### **Download table data**
* Click on the **download** button located next to the **Columns button**
Some tables allow users to select whether to download data as presented in the table or to download all raw data used to generate the data displayed in the table.
***
## Interact with Plots
Interact with plots and download data for external analysis.
### Show & hide data
* Show and hide data in certain plots by clicking the series within the plot legend.
By hiding selected data series, users can focus on more specific trends within a plot. In the image below, fuel data is hidden, allowing the user to quickly analyze monthly electricity trends.
### **Download table data**
* Click on the **download** button located next to the **Columns button**
Some tables allow users to select whether to download data as presented in the table or to download all raw data used to generate the data displayed in the table.
***
## Interact with Plots
Interact with plots and download data for external analysis.
### Show & hide data
* Show and hide data in certain plots by clicking the series within the plot legend.
By hiding selected data series, users can focus on more specific trends within a plot. In the image below, fuel data is hidden, allowing the user to quickly analyze monthly electricity trends.
 ### Hover over plots
* Mouseover different parts of a plot to learn more about the data in the plot
In the example below, users can mouseover a point to view details about each property, including the value and associated data completeness. Users can also click on the property name to jump to that property.
### Hover over plots
* Mouseover different parts of a plot to learn more about the data in the plot
In the example below, users can mouseover a point to view details about each property, including the value and associated data completeness. Users can also click on the property name to jump to that property.
 ### Download data
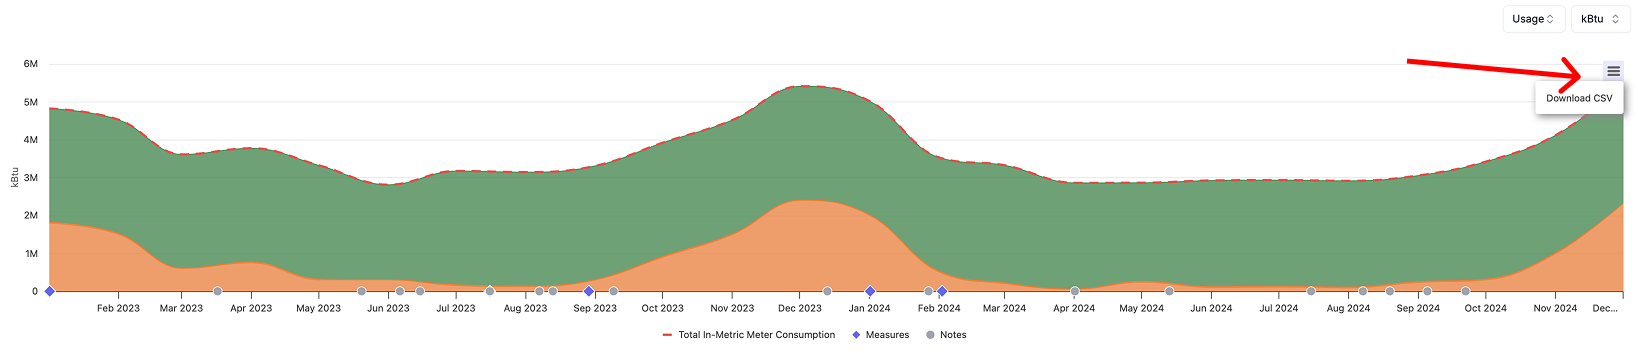
* Download data from certain plots by clicking the hamburger menu in the top-right of the plot.
In the example below, users can download all the monthly energy consumption values in the plot by clicking on the hamburger menu.
### Download data
* Download data from certain plots by clicking the hamburger menu in the top-right of the plot.
In the example below, users can download all the monthly energy consumption values in the plot by clicking on the hamburger menu.
 ***
***