> ## Documentation Index
> Fetch the complete documentation index at: https://docs.abisko.io/llms.txt
> Use this file to discover all available pages before exploring further.
# Data Completeness (%)
> Understand the extent of missing utility data over any reporting period.
Data completeness represents the ratio of days with available utility data to the total number of days for which data is expected. This is a time-based metric that enables users to quickly understand the extent to which performance metrics represent complete data.
| **Rating** | **Data Completeness Value** | **Gap Days over Reporting Period** |
| :--------- | :-------------------------- | :--------------------------------- |
| Excellent | 97-100% | Less than 12 Days |
| Good | 92-97% | Between 12-20 Days |
| Passable | 83-92% | Between 30-60 Days |
| Poor | 66-83% | Between 60-120 Days |
| Very Poor | 0-66% | More than 120 Days |
***
## How It's Calculated
Data Completeness (%) is calculated at multiple levels:
* **Meter**: Every meter has a data completeness (%) for each 12-month reporting period as well as for the entirety of the meter activation period (i.e. all-time).
* **Property**: Every property has a data completeness (%) for each 12-month reporting period for each utility type and subtype aggregated across all meters, including:
* **Energy**: Total Energy, Total Electricity, Total Fuel, Total District Heating & Cooling
* **Emissions**: Total Emissions, Direct Emissions, Indirect Emissions, Scope 1/2/3 Emissions
* **Water:** Total Water, Potable Water, Reclaimed Water, Well Water
* **Portfolio**: Each portfolio presents data completeness (%) for each 12-month reporting period for each utility type and subtype aggregated across all properties.
Data Completeness = (Actual Days with Data / Expected Days with Data) × 100%
### Meter-level Calculation
How data completeness (%) is calculated for an individual meter
**Example**: The electric meter pictured below has data for all months in a 12-month reporting period except July and August. The property is owned and the meter is active is over all 12-months.
 * Expected days with data = 365
* Actual data with data = 303
* **Meter Data Completeness = 303 / 365 = 83%**
### Property-level Calculation
How data completeness (%) is calculated for at the property level
**Example**: A property has 4 energy meters (3 electric; 1 fuel). The property is owned and all meters are active over all 12-months of the reporting period.
* Expected days with data = 365
* Actual data with data = 303
* **Meter Data Completeness = 303 / 365 = 83%**
### Property-level Calculation
How data completeness (%) is calculated for at the property level
**Example**: A property has 4 energy meters (3 electric; 1 fuel). The property is owned and all meters are active over all 12-months of the reporting period.
 Individual Meters
* Electric Meter 1: Data Completeness = \[303 / 365] = 83%
* Electric Meter 2: Data Completeness = \[306 / 365] = 84% *(Note: February has 28 days)*
* Electric Meter 3: Data Completeness = \[365 / 365] = 100%
* Fuel Meter 1: Data Completeness = \[184 / 365] = 50.4% *(Note: 6-month end gap)*
**Property Level**
* Total Electricity Data Completeness = \[303 + 306 + 365] / \[365\*3] = 89%
* Total Fuel Data Completeness = 184 / 365 = 50.4%
* **Total Energy Data Completeness = \[303 + 306 + 365 + 184] / \[365\*4] = 79.3%**
***
## Tracking Data Completeness
Abisko calculates and reports performance metrics with corresponding data completeness values throughout the platform to allow users to decide whether to report incomplete data as-is or address the issues to increase data completeness.
### Property Level
View meter-level and property-level data completeness in multiple property locations.
**Navigate to Property → Data Quality**
* View a summary of data completeness (%) & data quality metrics by utility type and meter
Individual Meters
* Electric Meter 1: Data Completeness = \[303 / 365] = 83%
* Electric Meter 2: Data Completeness = \[306 / 365] = 84% *(Note: February has 28 days)*
* Electric Meter 3: Data Completeness = \[365 / 365] = 100%
* Fuel Meter 1: Data Completeness = \[184 / 365] = 50.4% *(Note: 6-month end gap)*
**Property Level**
* Total Electricity Data Completeness = \[303 + 306 + 365] / \[365\*3] = 89%
* Total Fuel Data Completeness = 184 / 365 = 50.4%
* **Total Energy Data Completeness = \[303 + 306 + 365 + 184] / \[365\*4] = 79.3%**
***
## Tracking Data Completeness
Abisko calculates and reports performance metrics with corresponding data completeness values throughout the platform to allow users to decide whether to report incomplete data as-is or address the issues to increase data completeness.
### Property Level
View meter-level and property-level data completeness in multiple property locations.
**Navigate to Property → Data Quality**
* View a summary of data completeness (%) & data quality metrics by utility type and meter
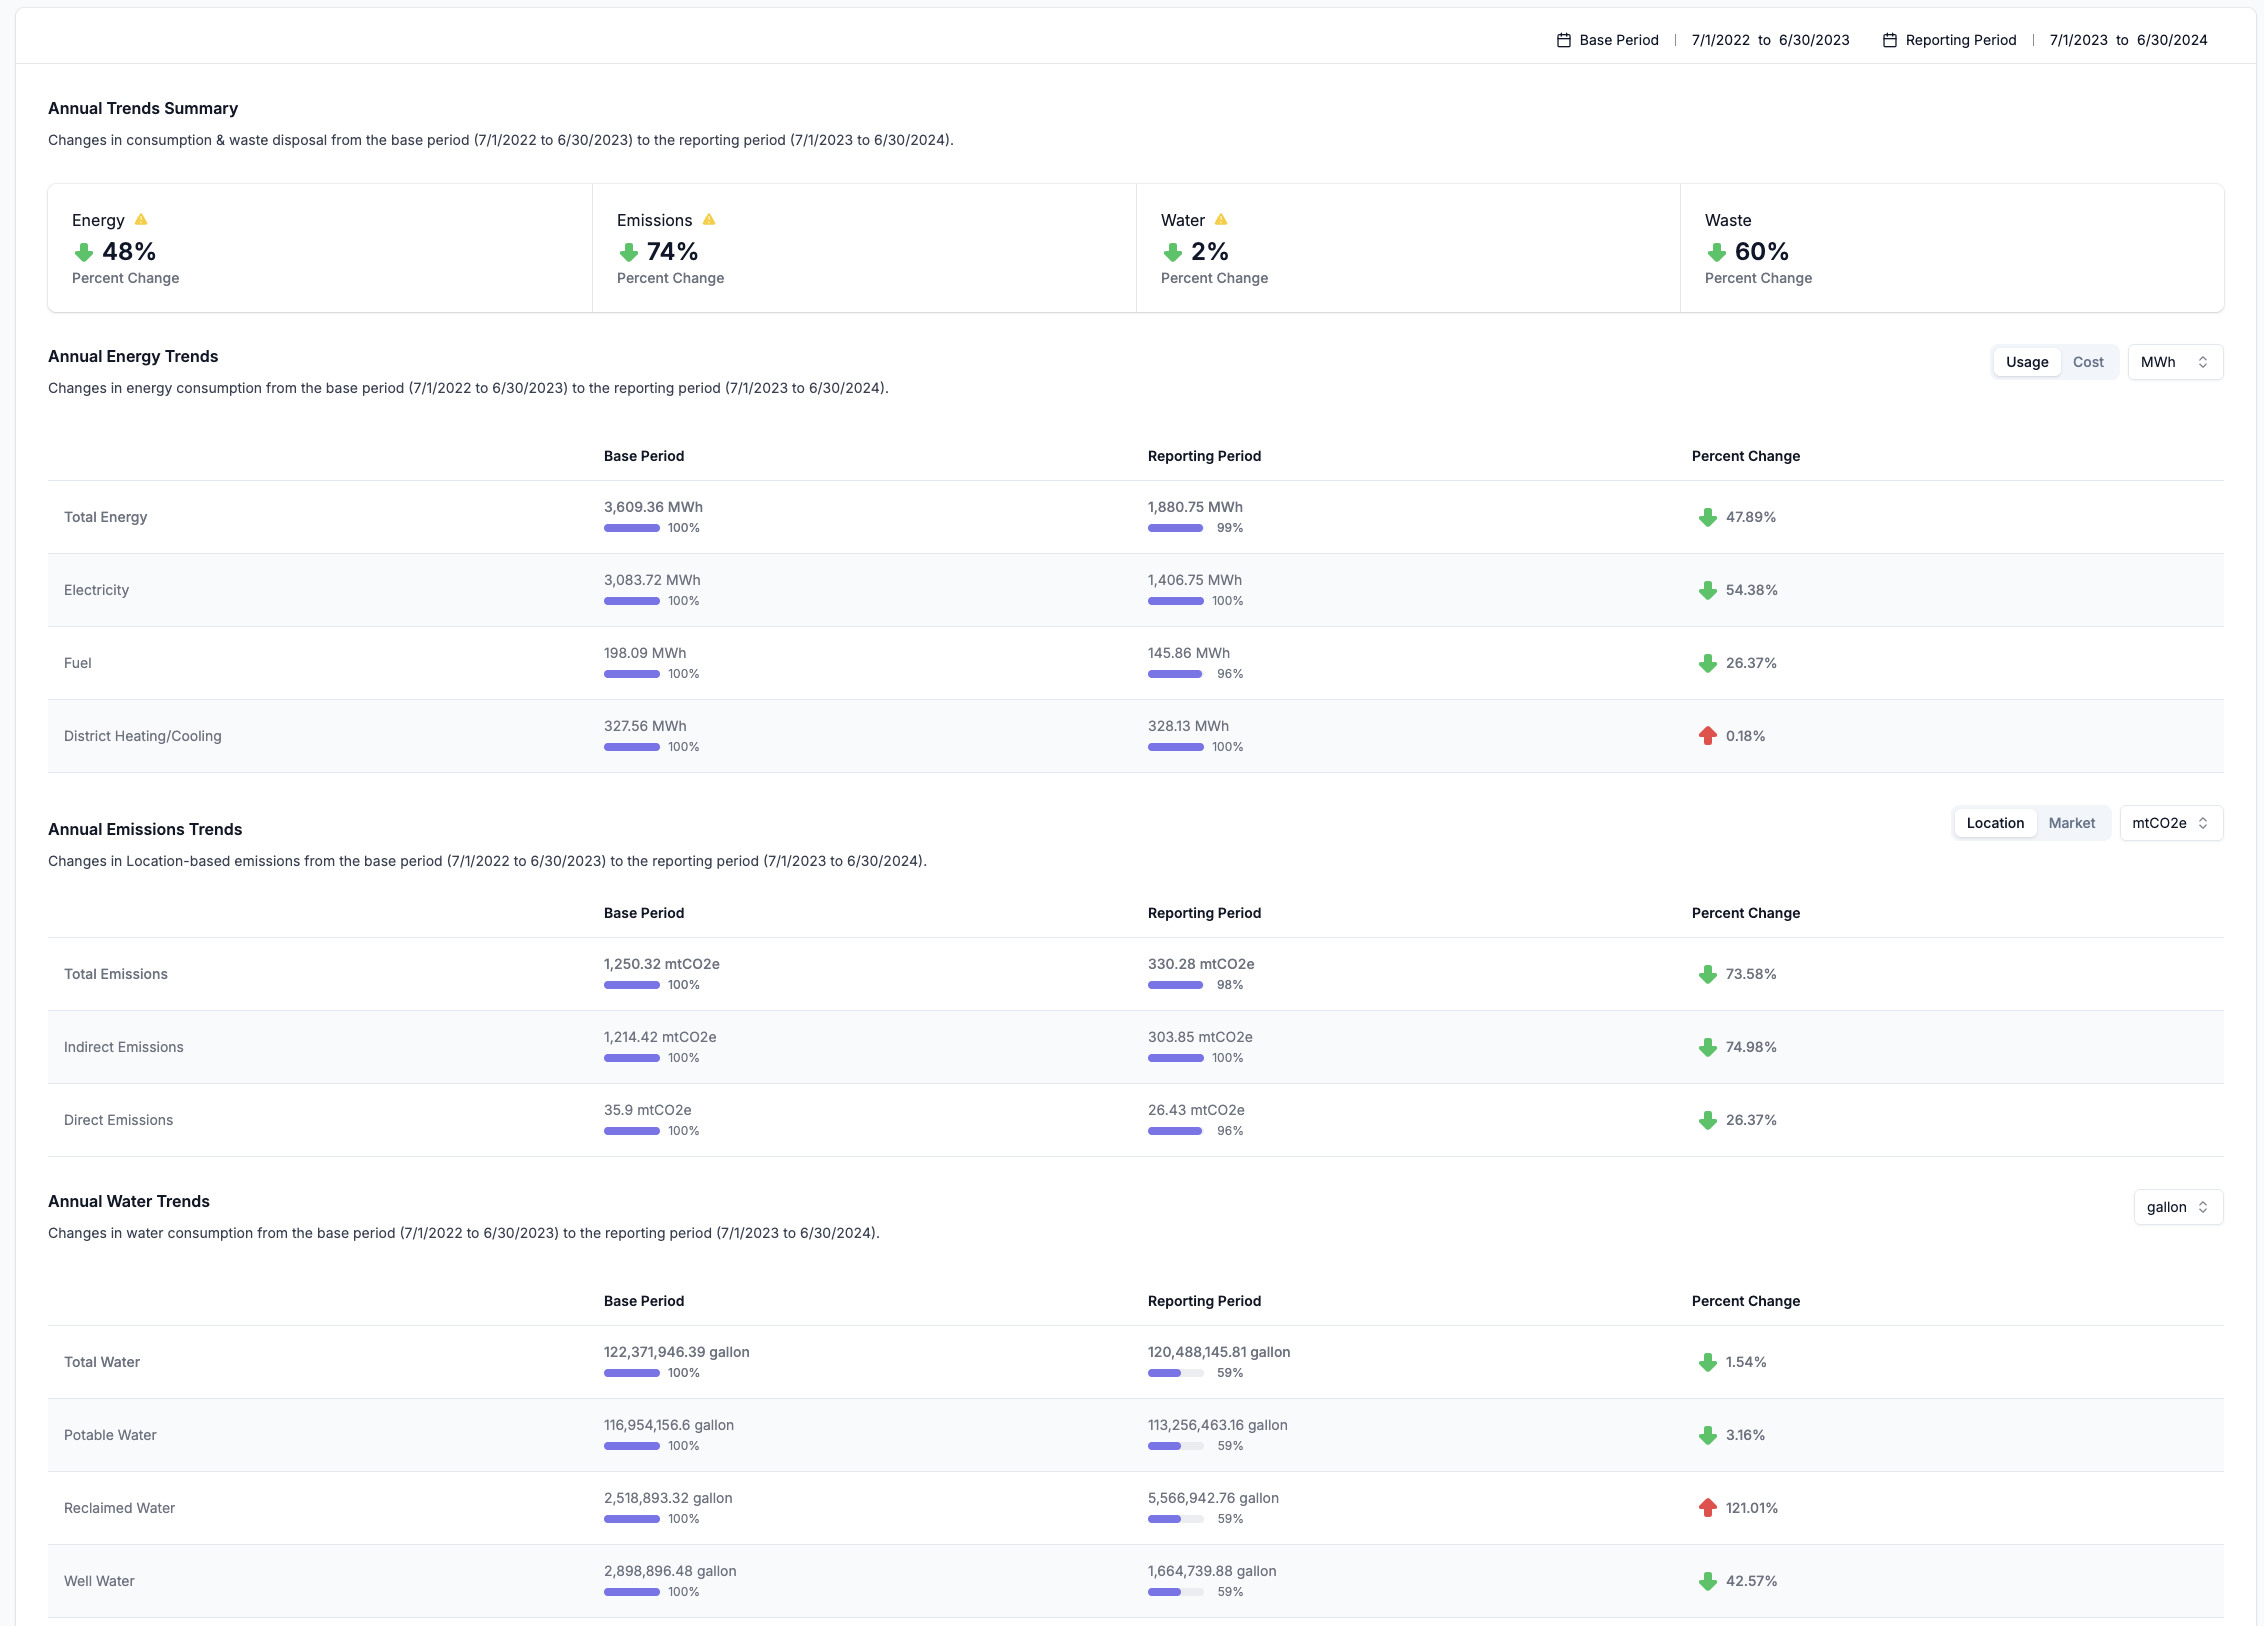
 **Navigate to Property → Annual Trends**
* View a summary of data completeness (%) & performance metrics by utility type
**Navigate to Property → Annual Trends**
* View a summary of data completeness (%) & performance metrics by utility type
 **Navigate to Property → Meters → Energy / Water / Waste**
* View all-time and reporting period data completeness (%) for every individual meter
**Navigate to Property → Meters → Energy / Water / Waste**
* View all-time and reporting period data completeness (%) for every individual meter
 ### Portfolio Level
View property-level and portfolio-level data completeness in multiple portfolio locations.
**Navigate to Property → Portfolio Trends → Energy / Emissions / Water**
* View portfolio-level data completeness (%) & performance metrics by utility type
### Portfolio Level
View property-level and portfolio-level data completeness in multiple portfolio locations.
**Navigate to Property → Portfolio Trends → Energy / Emissions / Water**
* View portfolio-level data completeness (%) & performance metrics by utility type
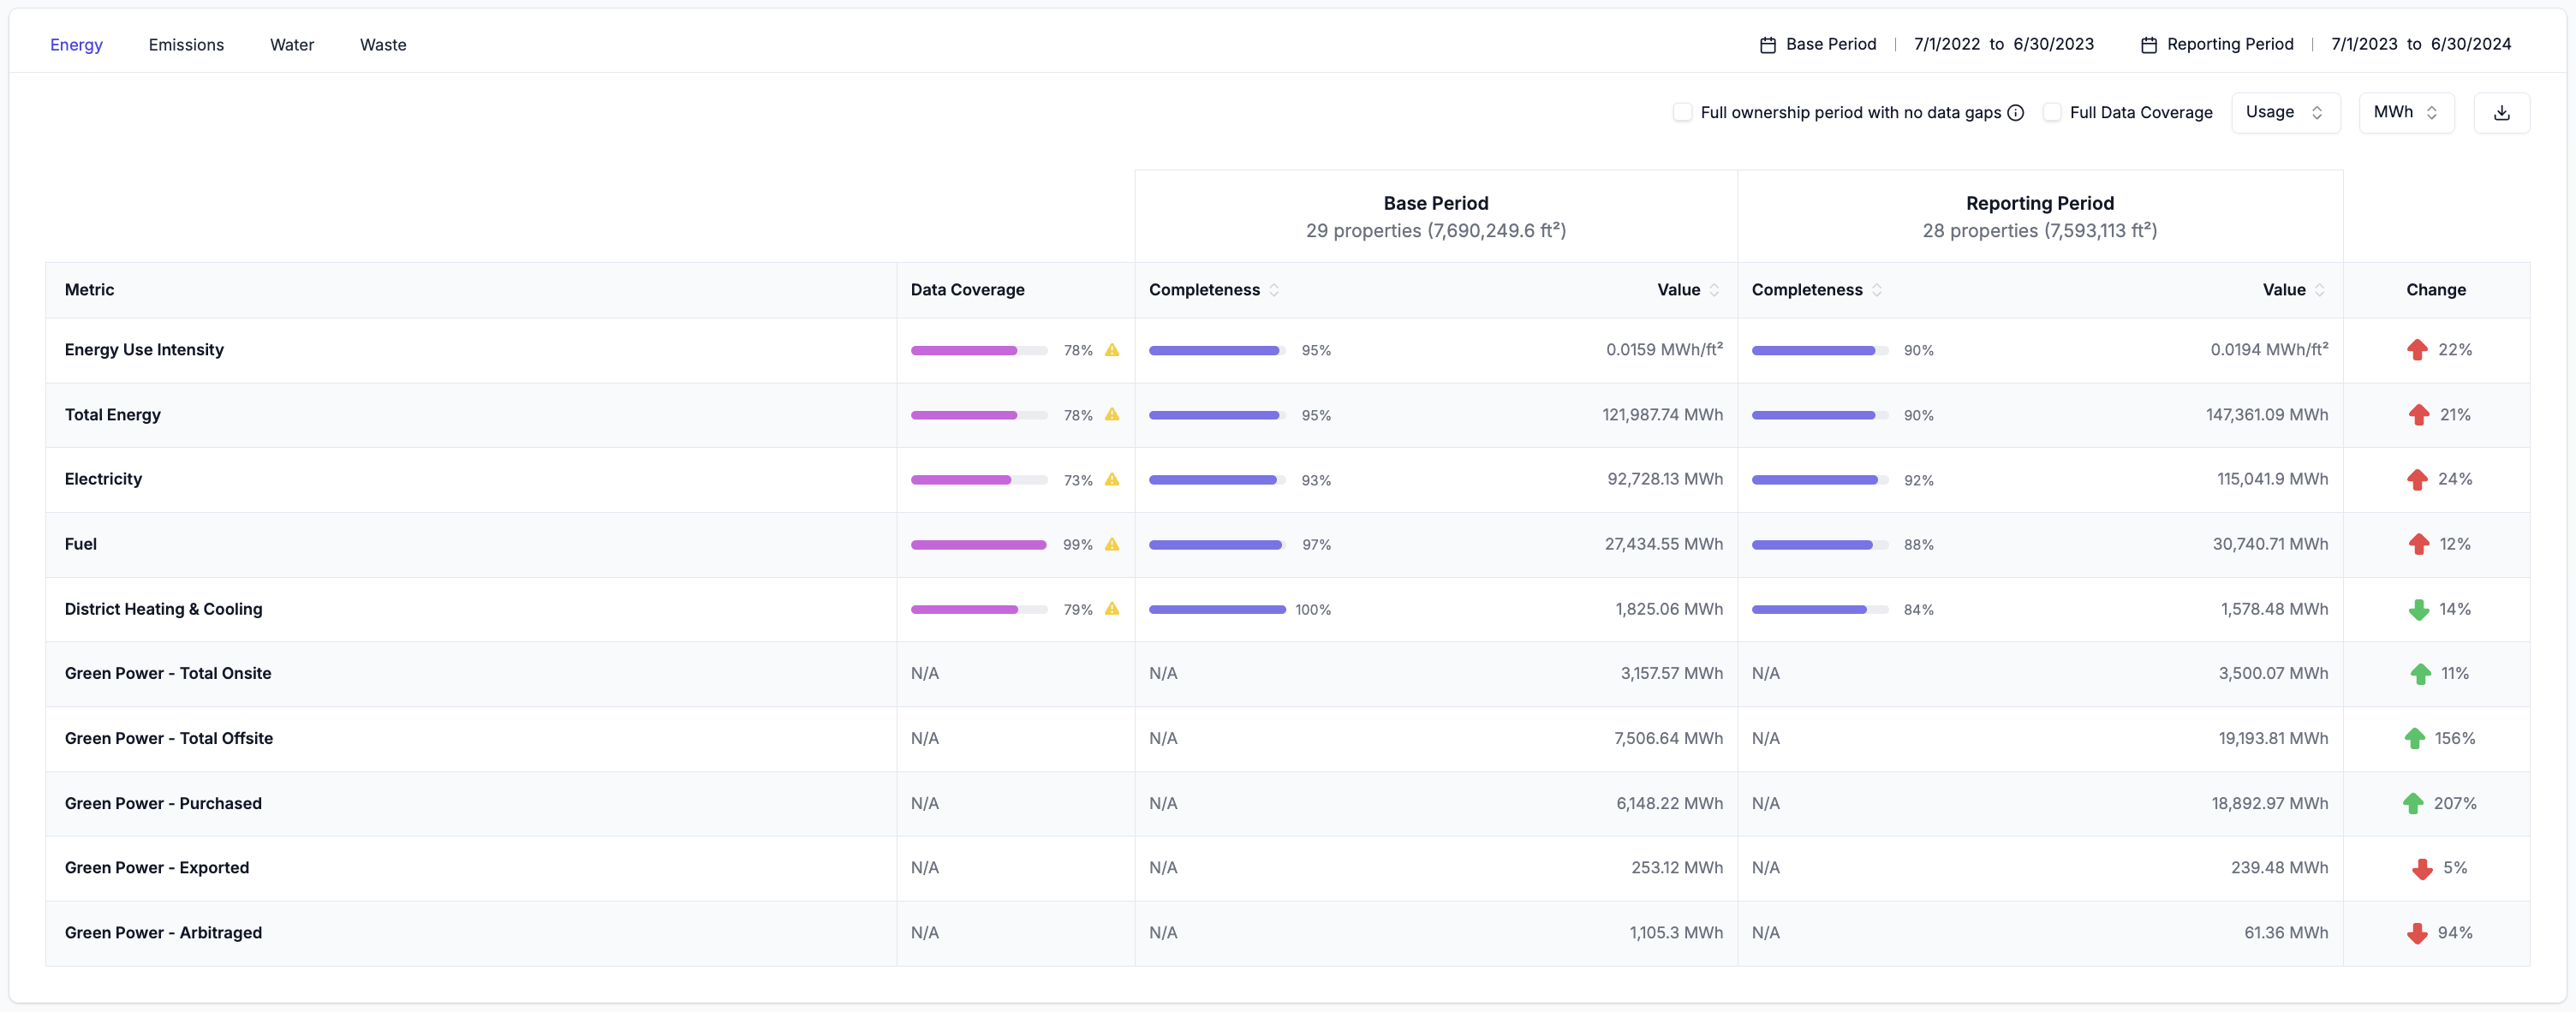 **Navigate to Property → Property Trends → Energy / Emissions / Water**
* View data completeness (%) & performance metrics for each property by utility type
**Navigate to Property → Property Trends → Energy / Emissions / Water**
* View data completeness (%) & performance metrics for each property by utility type
 ***
***