> ## Documentation Index
> Fetch the complete documentation index at: https://docs.abisko.io/llms.txt
> Use this file to discover all available pages before exploring further.
# NYC Local Law 97
> Assessing performance, limits, non-compliance exposure and penalties.
**Navigate to Property → Compliance → Exposure → New York City - LL97**
## Overview
Enacted in 2019, New York City’s Local Law 97 (LL97) aims to reduce GHG emissions from large buildings. The law establishes annual emissions limits for most buildings larger than 25,000 ft2, based on their property use types as tracked in ENERGY STAR® Portfolio Manager (ESPM). Properties must meet their assigned emissions limits each year by reducing energy consumption.
### LL97 Resources
| Page | Link |
| -------------- | ----------------------------------------------------------------------------------------------------------------------------- |
| Knowledge Base | [https://nyc.beam-portal.org/helpdesk/kb/](https://nyc.beam-portal.org/helpdesk/kb/) |
| FAQs | [https://www.nyc.gov/assets/buildings/pdf/processing\_faqs.pdf](https://www.nyc.gov/assets/buildings/pdf/processing_faqs.pdf) |
| BEAM Portal | [https://nyc.beam-portal.org/](https://nyc.beam-portal.org/) |
### Filing & Reporting
Property owners must file a report with NYC on May 1st of every year, showing whether they are in or out of compliance and the amount by which they exceed their emissions limit. The report must be certified by a registered professional.
Failure to file a required report may result in a penalty of up to \$0.50 per square foot of gross floor area for each month the violation remains uncorrected, beginning after the 12-month period following the reporting deadline. However, no penalty will be assessed if a report demonstrating compliance is filed within 60 days of the original due date.
***
## Configuration
Click the **Details** button at the top of the report to view a list of resources and other relevant information, such as **NYC BBL/BIN** identifiers tracked in ESPM.
Follow these steps to ensure that the property is ready for compliance analysis:
1. Confirm the selected [Reporting Period](/getting-started/reporting-period): Emissions calculations, penalty values, and decarb pathways all depend on the selected reporting period. Change the reporting period to see how property performance over different 12-month time frames impacts compliance.
2. Click on **Details** button to ensure that there is a high [Data Completeness](/data-quality/data-completeness) value associated with the reporting period. Data completeness should be as close to 100% as possible to ensure accurate analysis.
***
## Calculating Emissions Limits
A building’s emissions limit is based on the breakdown of its property uses as tracked in ESPM. Abisko automatically calculates a property’s emissions limits and transparently displays each step of the calculation process.
### ESPM Property Uses
Abisko retrieves all ESPM property uses associated with the property along with corresponding floor areas. Users can view all property uses in the following table, which is located near the bottom of the **LL97 Report**.
 ### Property Use Type Emissions Limits
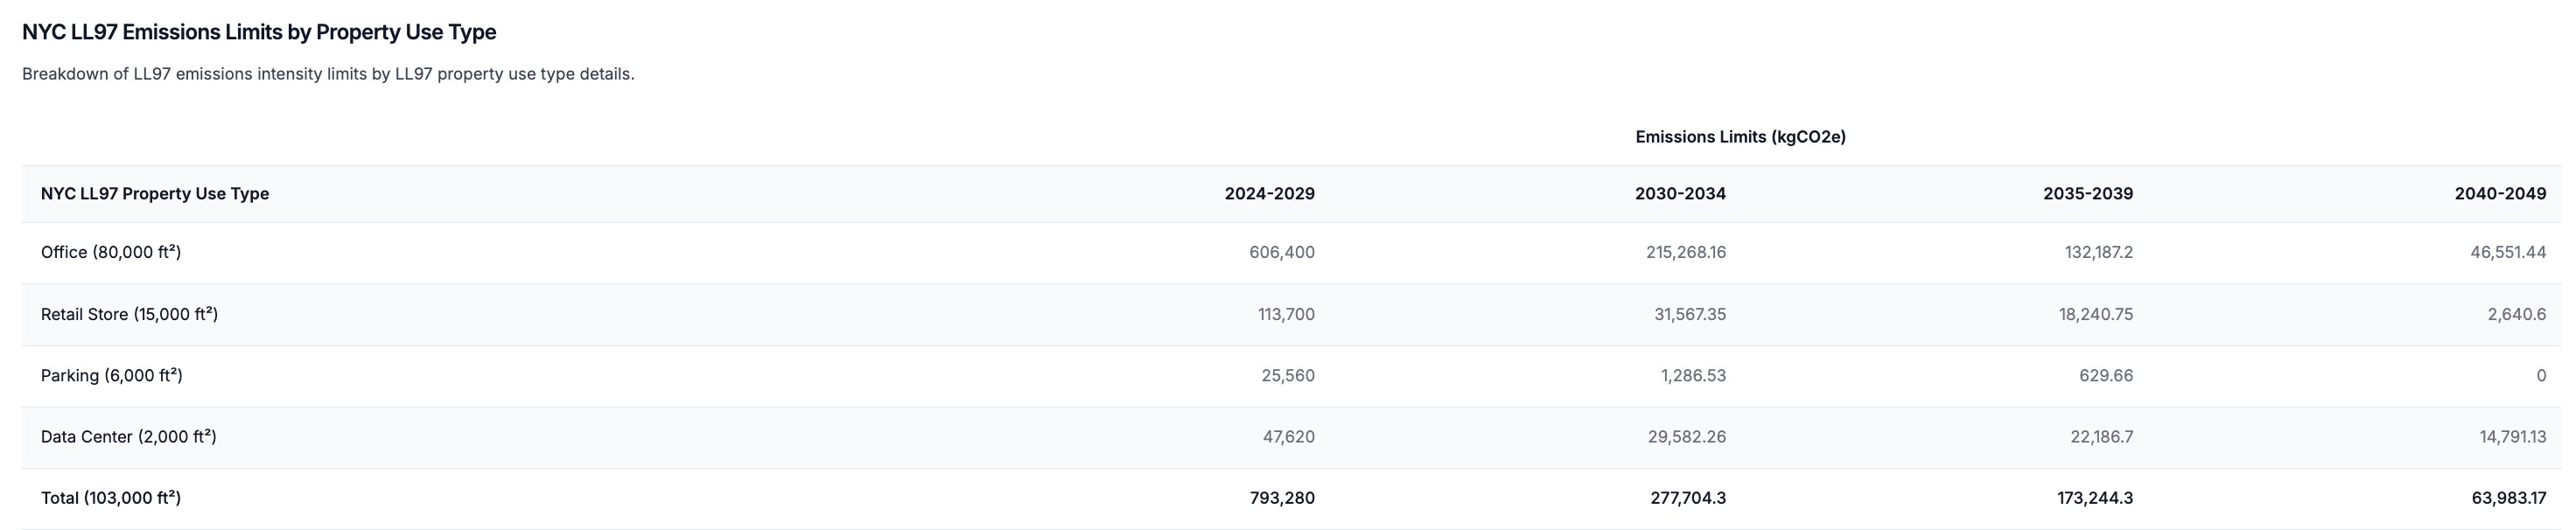
Abisko aggregates floor area by property use type and calculates emissions limits for each type and compliance period through 2050. These limits are determined by multiplying the total floor area of each property use type by its corresponding emissions factor.
[Click here](https://www.nyc.gov/assets/buildings/rules/1_RCNY_103-14.pdf) to view the emissions factors for each ESPM property use type.
### Property Use Type Emissions Limits
Abisko aggregates floor area by property use type and calculates emissions limits for each type and compliance period through 2050. These limits are determined by multiplying the total floor area of each property use type by its corresponding emissions factor.
[Click here](https://www.nyc.gov/assets/buildings/rules/1_RCNY_103-14.pdf) to view the emissions factors for each ESPM property use type.
 ### Total Emissions Limits
The total emissions limit is calculating by taking the sum of all component property use type limits for each compliance period.
𝐵 = Σ (𝑙𝑘∙𝑠𝑘)
* B = the total building emissions limit for a building with multiple property types
* 𝑙𝑘= the emissions factor of each given property type, k, as specified in Article 320 or in the rule, in tCO2e per square foot
* 𝑠𝑘= the total floor area in square feet of each property type or occupancy group, k, in a covered building
***
## Calculating Penalties
To assess potential non-compliance penalties, a property’s annual energy use must be calculated for each energy subtype (e.g. electricity, natural gas, district heating), converted into annual emissions values using LL97 factors, and compared against the property’s annual emissions limit.
### Property Emissions
Property emissions are calculated by multiplying the total annual consumption for each energy subtype by the corresponding emissions factor and summing the results. The electricity emissions factor assumes an electric grid with lower carbon intensity over time.
For example, the **electricity** emissions factor drops from .000288962 tCO2e per kWh to 0.000145 after 2029, thus projecting a reduction in a property's future electricity-related emissions.
[Click here](https://www.nyc.gov/assets/buildings/rules/1_RCNY_103-14.pdf) to view the emissions factors for each energy subtype over time.
At the top of the report, users can view a chart showing the property’s estimated emissions by energy subtype through 2050. All emissions are calculated using LL97 emissions factors, and users can hover over a bar to see details or download the data using the button above the chart.
### Total Emissions Limits
The total emissions limit is calculating by taking the sum of all component property use type limits for each compliance period.
𝐵 = Σ (𝑙𝑘∙𝑠𝑘)
* B = the total building emissions limit for a building with multiple property types
* 𝑙𝑘= the emissions factor of each given property type, k, as specified in Article 320 or in the rule, in tCO2e per square foot
* 𝑠𝑘= the total floor area in square feet of each property type or occupancy group, k, in a covered building
***
## Calculating Penalties
To assess potential non-compliance penalties, a property’s annual energy use must be calculated for each energy subtype (e.g. electricity, natural gas, district heating), converted into annual emissions values using LL97 factors, and compared against the property’s annual emissions limit.
### Property Emissions
Property emissions are calculated by multiplying the total annual consumption for each energy subtype by the corresponding emissions factor and summing the results. The electricity emissions factor assumes an electric grid with lower carbon intensity over time.
For example, the **electricity** emissions factor drops from .000288962 tCO2e per kWh to 0.000145 after 2029, thus projecting a reduction in a property's future electricity-related emissions.
[Click here](https://www.nyc.gov/assets/buildings/rules/1_RCNY_103-14.pdf) to view the emissions factors for each energy subtype over time.
At the top of the report, users can view a chart showing the property’s estimated emissions by energy subtype through 2050. All emissions are calculated using LL97 emissions factors, and users can hover over a bar to see details or download the data using the button above the chart.
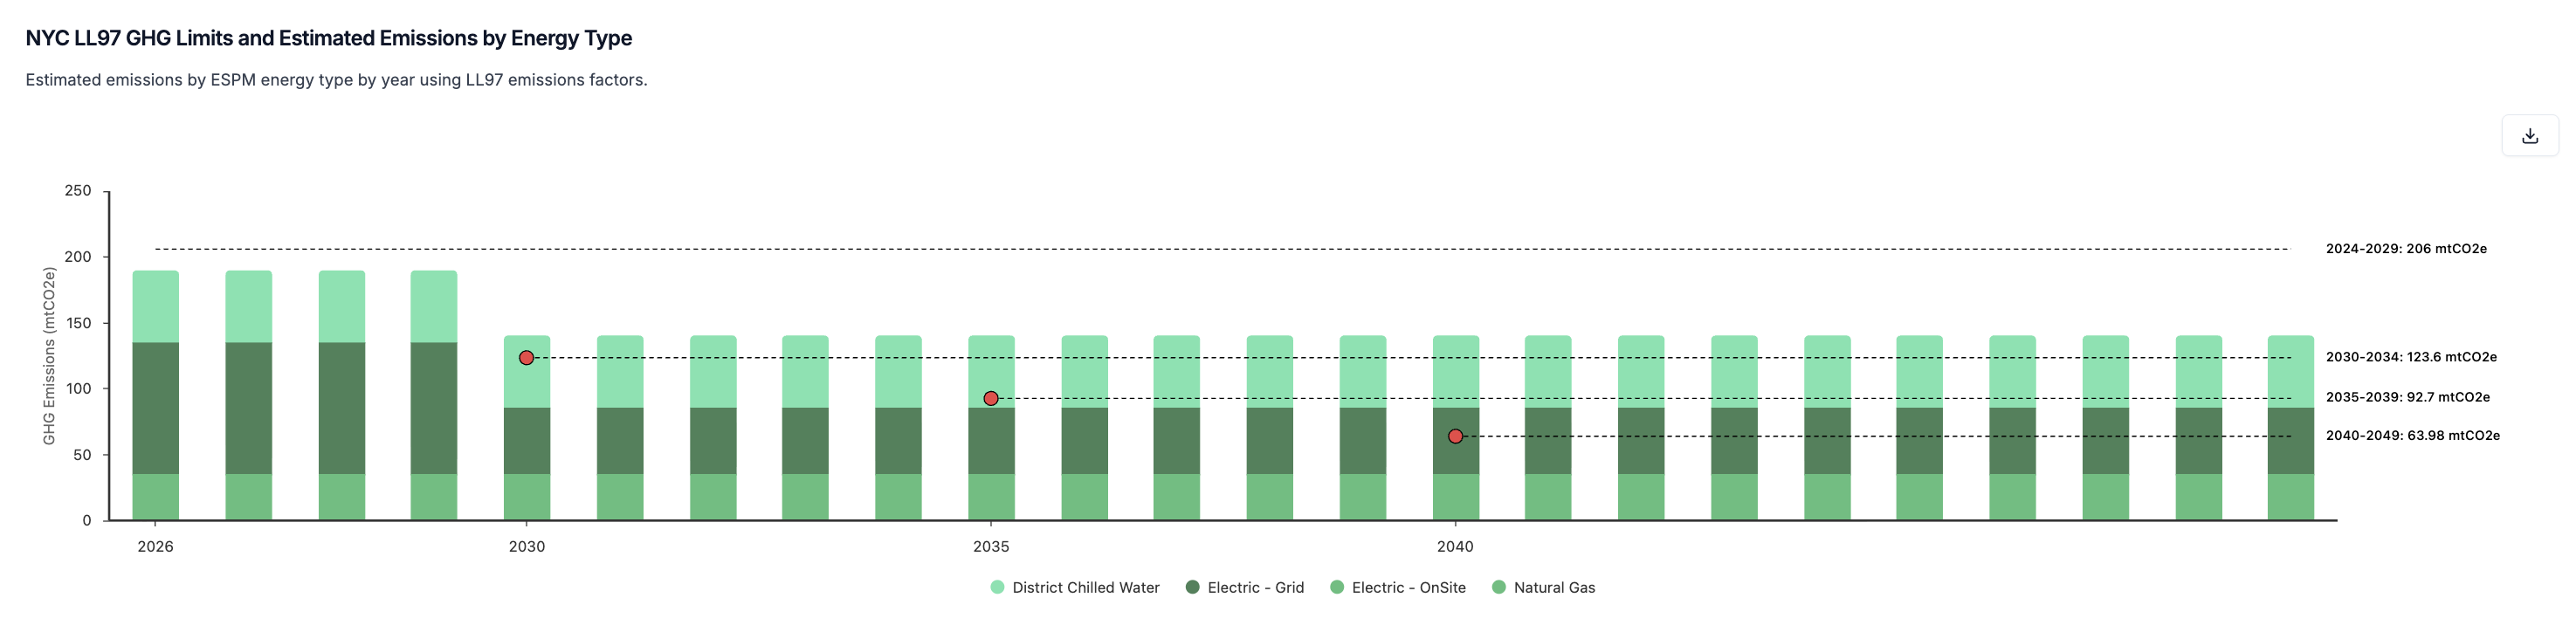 The above plot shows how electricity related emissions are projected to halve starting in 2030.
### Exceedance & Penalties
Under Local Law 97, non-compliance penalties are assessed when a building’s annual greenhouse gas emissions exceed its allowed emissions limit for a given year. The penalty is calculated by determining the difference between the building’s actual emissions and its limit, then multiplying that excess by the statutory penalty rate of \$268 per metric ton of CO₂e.
Users can view a plot of projected annual non-compliance penalties for each year through 2050.
The above plot shows how electricity related emissions are projected to halve starting in 2030.
### Exceedance & Penalties
Under Local Law 97, non-compliance penalties are assessed when a building’s annual greenhouse gas emissions exceed its allowed emissions limit for a given year. The penalty is calculated by determining the difference between the building’s actual emissions and its limit, then multiplying that excess by the statutory penalty rate of \$268 per metric ton of CO₂e.
Users can view a plot of projected annual non-compliance penalties for each year through 2050.
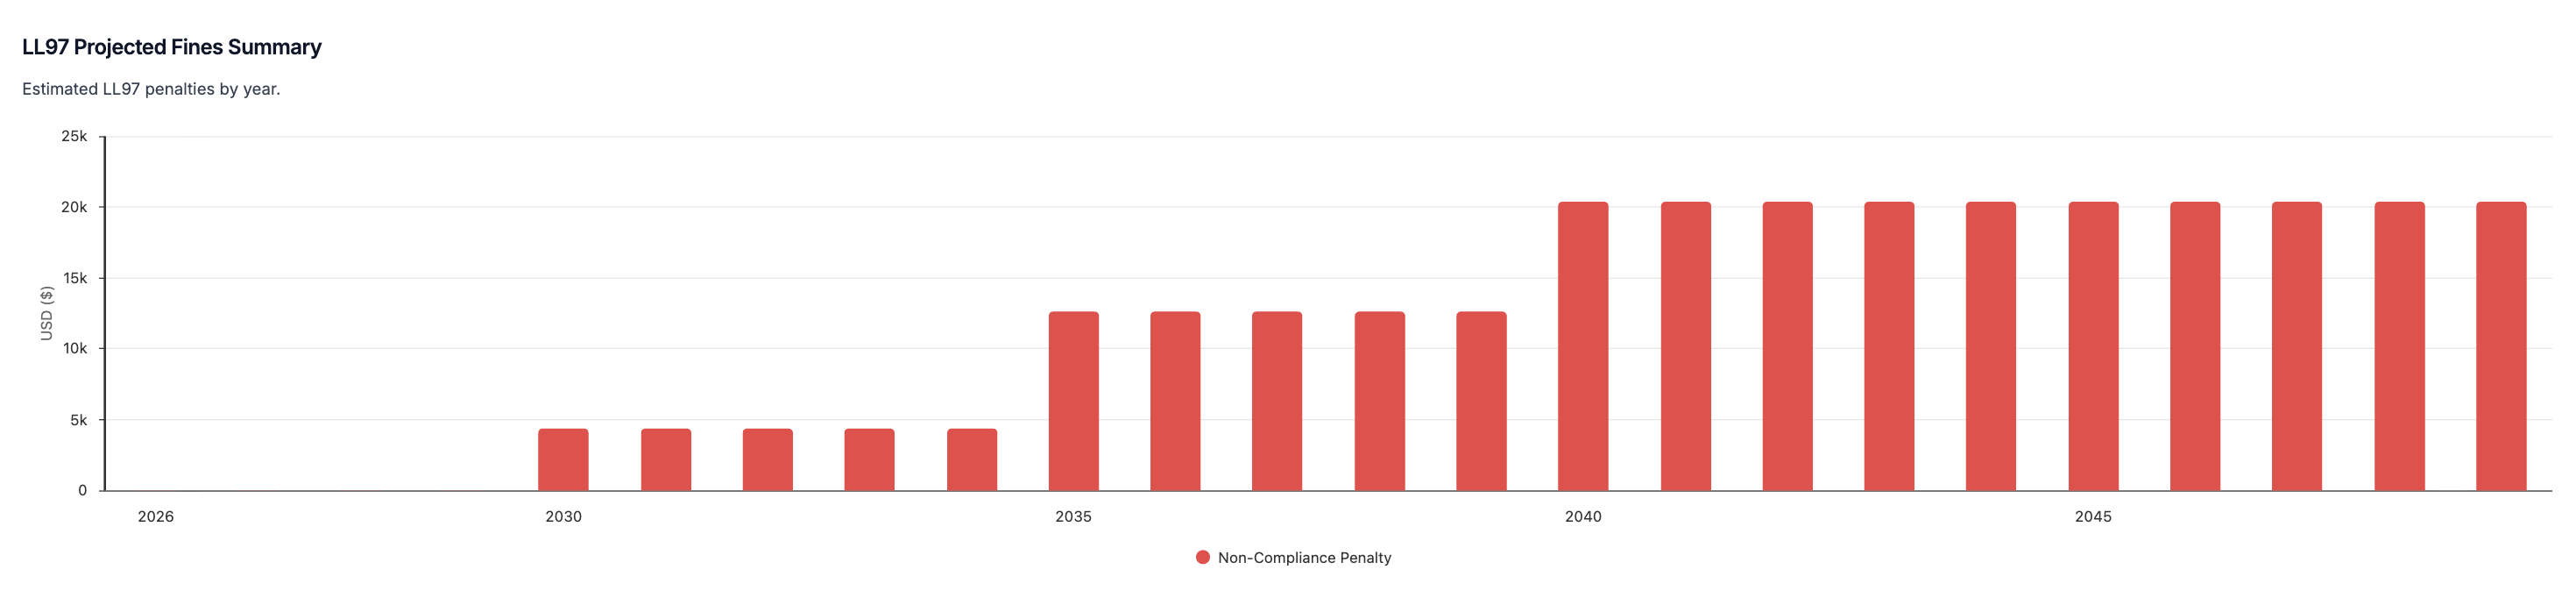 In the above plot, users can see that non-compliance penalties are projected to increase as emisisons limits become increasingly stringent.
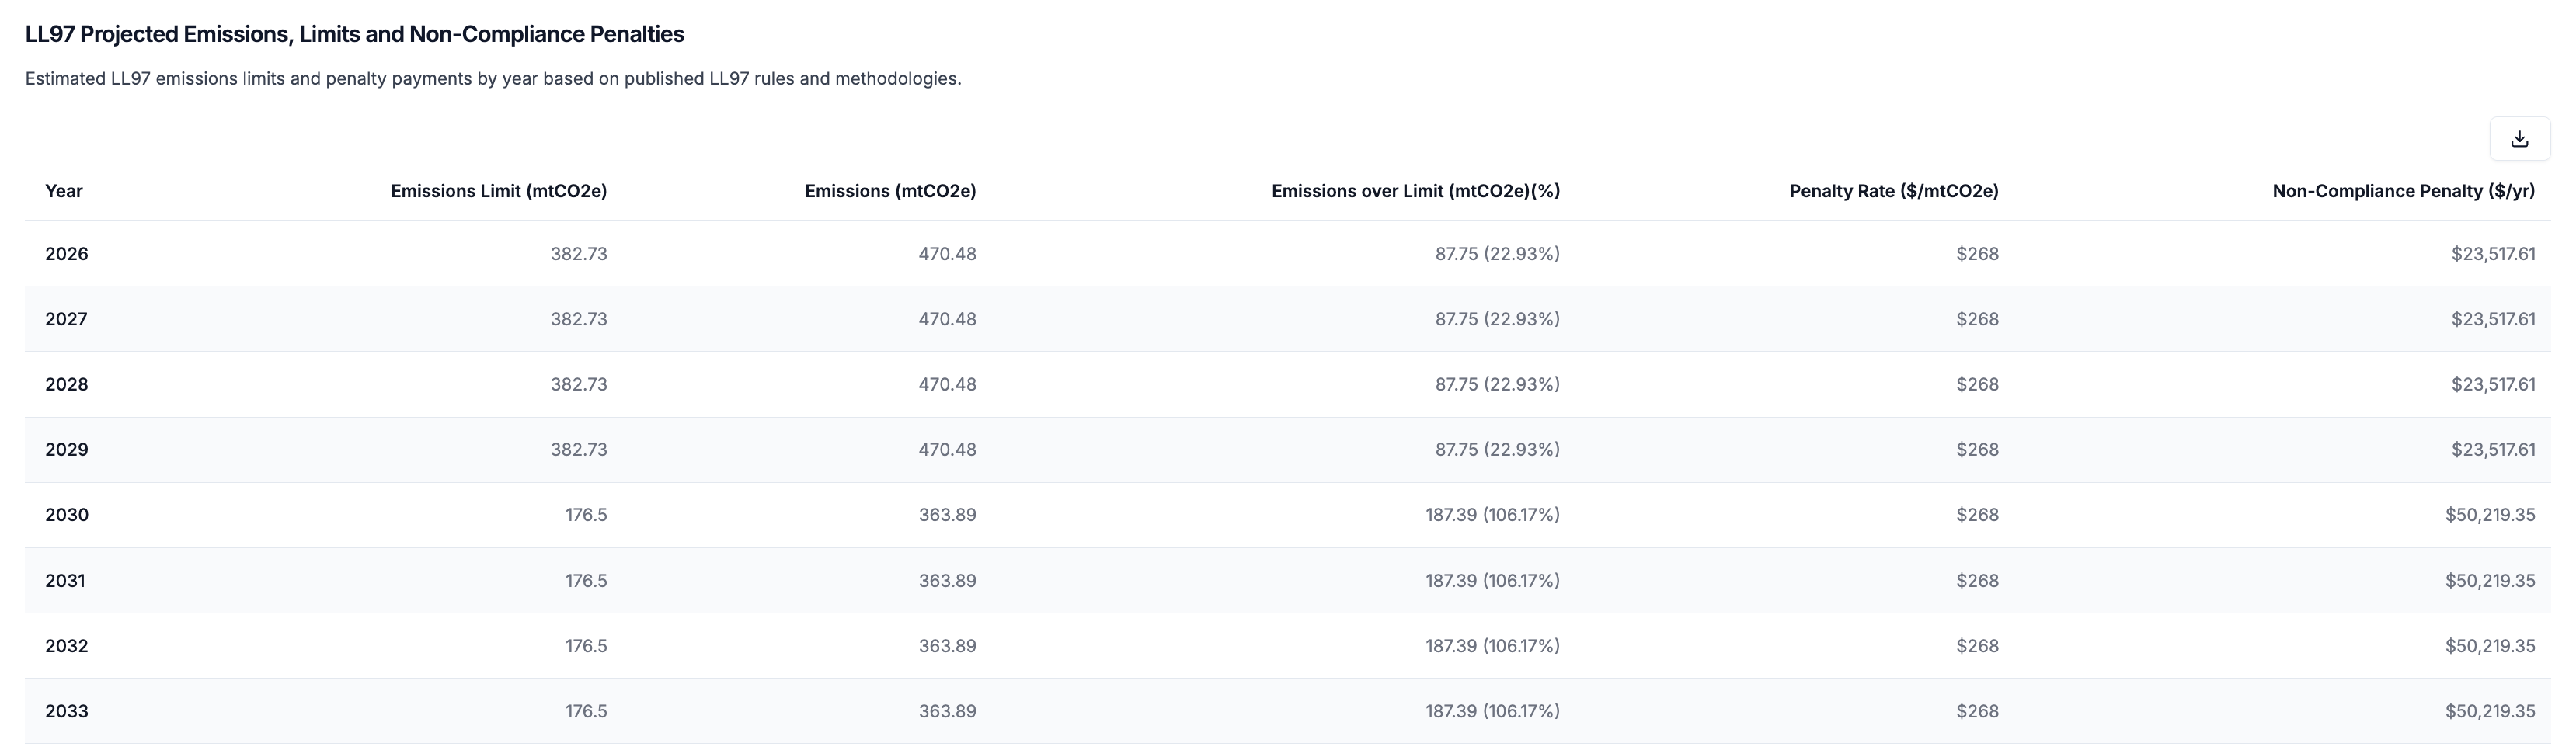
Abisko supplements the emissions and penalties charts with a detailed table showing property emissions, limits, and estimated penalties through 2050. Users can use this table to identify years in which the property is out of compliance and download the data for external analysis.
In the above plot, users can see that non-compliance penalties are projected to increase as emisisons limits become increasingly stringent.
Abisko supplements the emissions and penalties charts with a detailed table showing property emissions, limits, and estimated penalties through 2050. Users can use this table to identify years in which the property is out of compliance and download the data for external analysis.
 ***
## Setting Custom Limits
Abisko automatically calculates emissions and emissions limits using the default methodology outlined in published technical guidance. In some cases, however, buildings may be subject to alternative prescribed limits, or users may wish to evaluate non-compliance penalties under different assumptions.
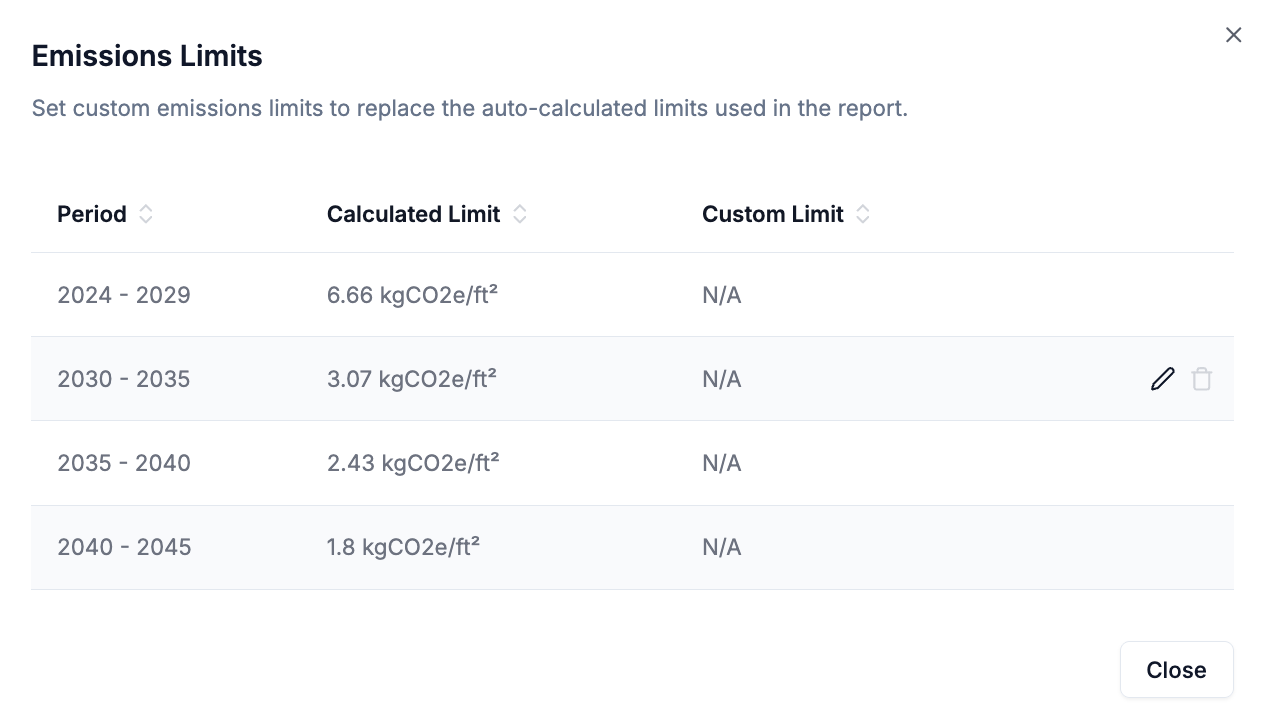
Abisko allows users to define custom emissions limits for each compliance period. Once custom limits are applied, Abisko automatically recalculates all compliance metrics and penalty estimates using those values. If no custom limits are defined, Abisko uses the default calculated limits.
### To Add/Edit/Delete Custom Limits
**Property → Compliance → Exposure → New York City - LL97**
* Click on the **Set Limits** button
***
## Setting Custom Limits
Abisko automatically calculates emissions and emissions limits using the default methodology outlined in published technical guidance. In some cases, however, buildings may be subject to alternative prescribed limits, or users may wish to evaluate non-compliance penalties under different assumptions.
Abisko allows users to define custom emissions limits for each compliance period. Once custom limits are applied, Abisko automatically recalculates all compliance metrics and penalty estimates using those values. If no custom limits are defined, Abisko uses the default calculated limits.
### To Add/Edit/Delete Custom Limits
**Property → Compliance → Exposure → New York City - LL97**
* Click on the **Set Limits** button
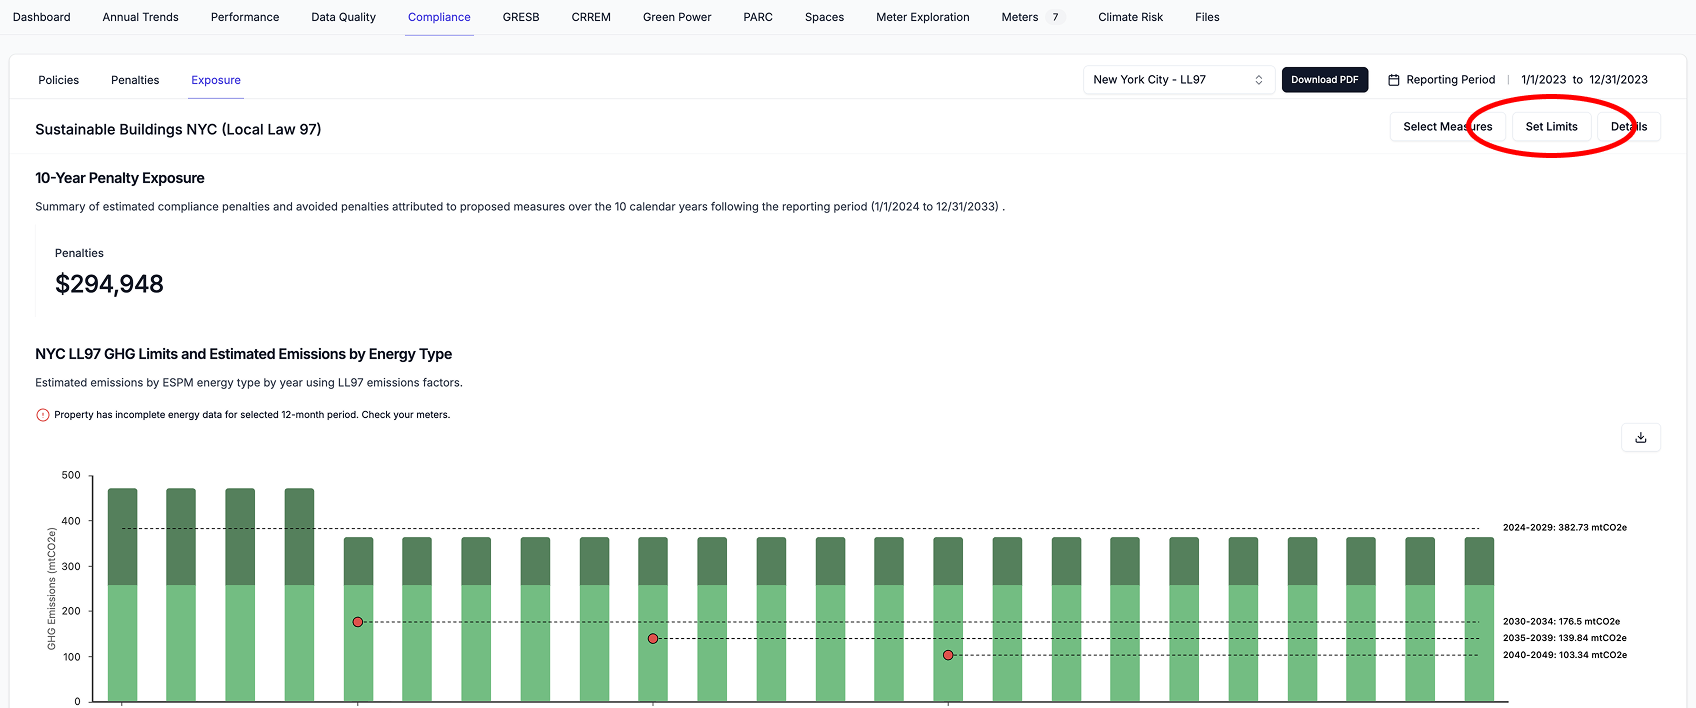 * Open the LL97 **Emissions Limits** sidebar
* **To add/edit a custom limit**
1. Hover the mouse over the row in the table for the limit you would like to edit
2. Click the **edit icon** that shows itself
3. Edit the limit and save
* **To delete a custom limit**
1. Hover the mouse over the row in the table for the limit you would like to delete
2. Click the **trash icon** that shows itself on the right side to delete
* Open the LL97 **Emissions Limits** sidebar
* **To add/edit a custom limit**
1. Hover the mouse over the row in the table for the limit you would like to edit
2. Click the **edit icon** that shows itself
3. Edit the limit and save
* **To delete a custom limit**
1. Hover the mouse over the row in the table for the limit you would like to delete
2. Click the **trash icon** that shows itself on the right side to delete
 ***
## Decarbonization Pathways
Abisko enables users to evaluate the impacts of proposed energy measures on property emissions within the context of LL97. Users can model different combinations of measures and see how each scenario affects emissions levels and non-compliance penalties through 2050. This allows users to align long-term decarbonization strategies with Building Performance Standards (BPS) requirements and capital planning efforts.
**With this feature, users can:**
* Test different decarbonization pathways and their regulatory exposure
* Identify the most cost-effective emissions reduction strategies
* Prepare and submit decarbonization plans to local regulators
### Select Measures
**Property → Compliance → Exposure → New York City - LL97**
* Click on the **Select Measures** button
***
## Decarbonization Pathways
Abisko enables users to evaluate the impacts of proposed energy measures on property emissions within the context of LL97. Users can model different combinations of measures and see how each scenario affects emissions levels and non-compliance penalties through 2050. This allows users to align long-term decarbonization strategies with Building Performance Standards (BPS) requirements and capital planning efforts.
**With this feature, users can:**
* Test different decarbonization pathways and their regulatory exposure
* Identify the most cost-effective emissions reduction strategies
* Prepare and submit decarbonization plans to local regulators
### Select Measures
**Property → Compliance → Exposure → New York City - LL97**
* Click on the **Select Measures** button
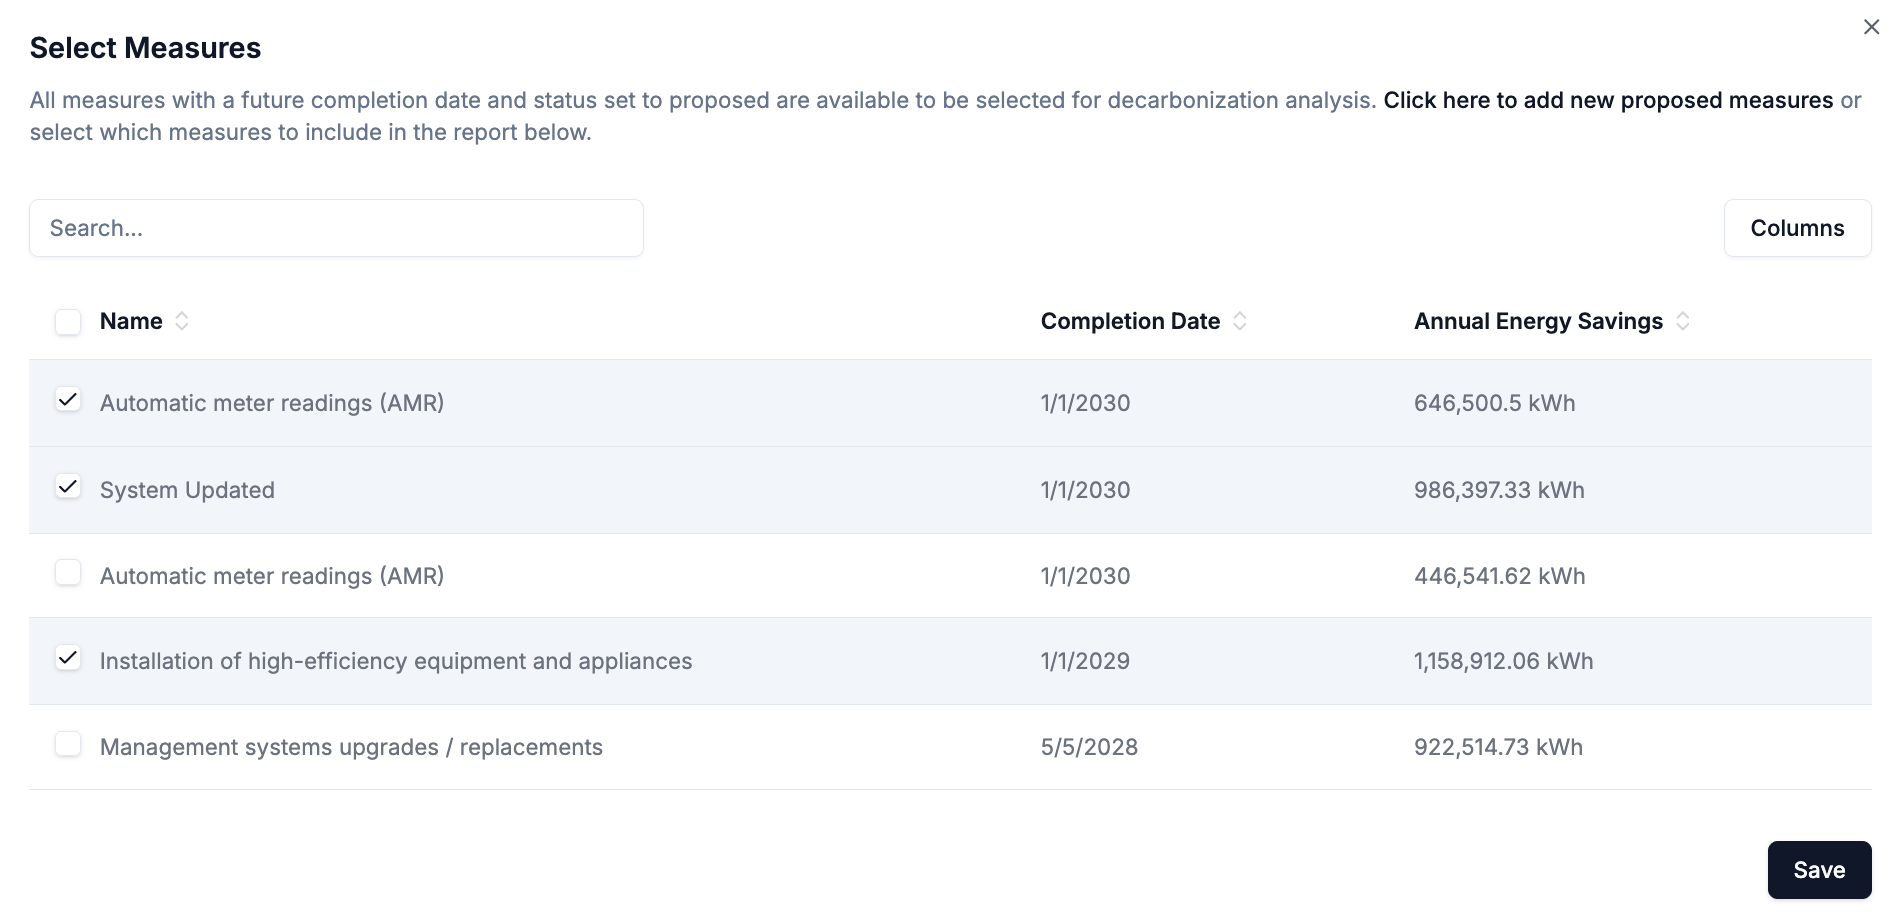
.png?fit=max&auto=format&n=5GjalMCAIzgaX7Jd&q=85&s=dac0a4122e5be4da0a0538706ced1dfc) * Open the LL97 **Measures Selection** sidebar
Only measures with a status marked as **Proposed** are included for selection, since they represent measures with a potential future implementation date.
* **Check the box** next to each measure that should be included in the compliance analysis
* Check the box above the table to automatically select all measures
* Click **save** after finalizing the measure selection
* Open the LL97 **Measures Selection** sidebar
Only measures with a status marked as **Proposed** are included for selection, since they represent measures with a potential future implementation date.
* **Check the box** next to each measure that should be included in the compliance analysis
* Check the box above the table to automatically select all measures
* Click **save** after finalizing the measure selection
 ### Review Charts & Tables
After saving all selected measures, all charts and tables in the report will automatically update to show the impact of each measure on the property annual emissions and non-compliance penalties.
* Proposed measure impacts will begin to take effect on the calendar year following the completion date of the measure.
* e.g. if completion date = 5/5/2028, changes begin to take effect 2029
### Review Charts & Tables
After saving all selected measures, all charts and tables in the report will automatically update to show the impact of each measure on the property annual emissions and non-compliance penalties.
* Proposed measure impacts will begin to take effect on the calendar year following the completion date of the measure.
* e.g. if completion date = 5/5/2028, changes begin to take effect 2029
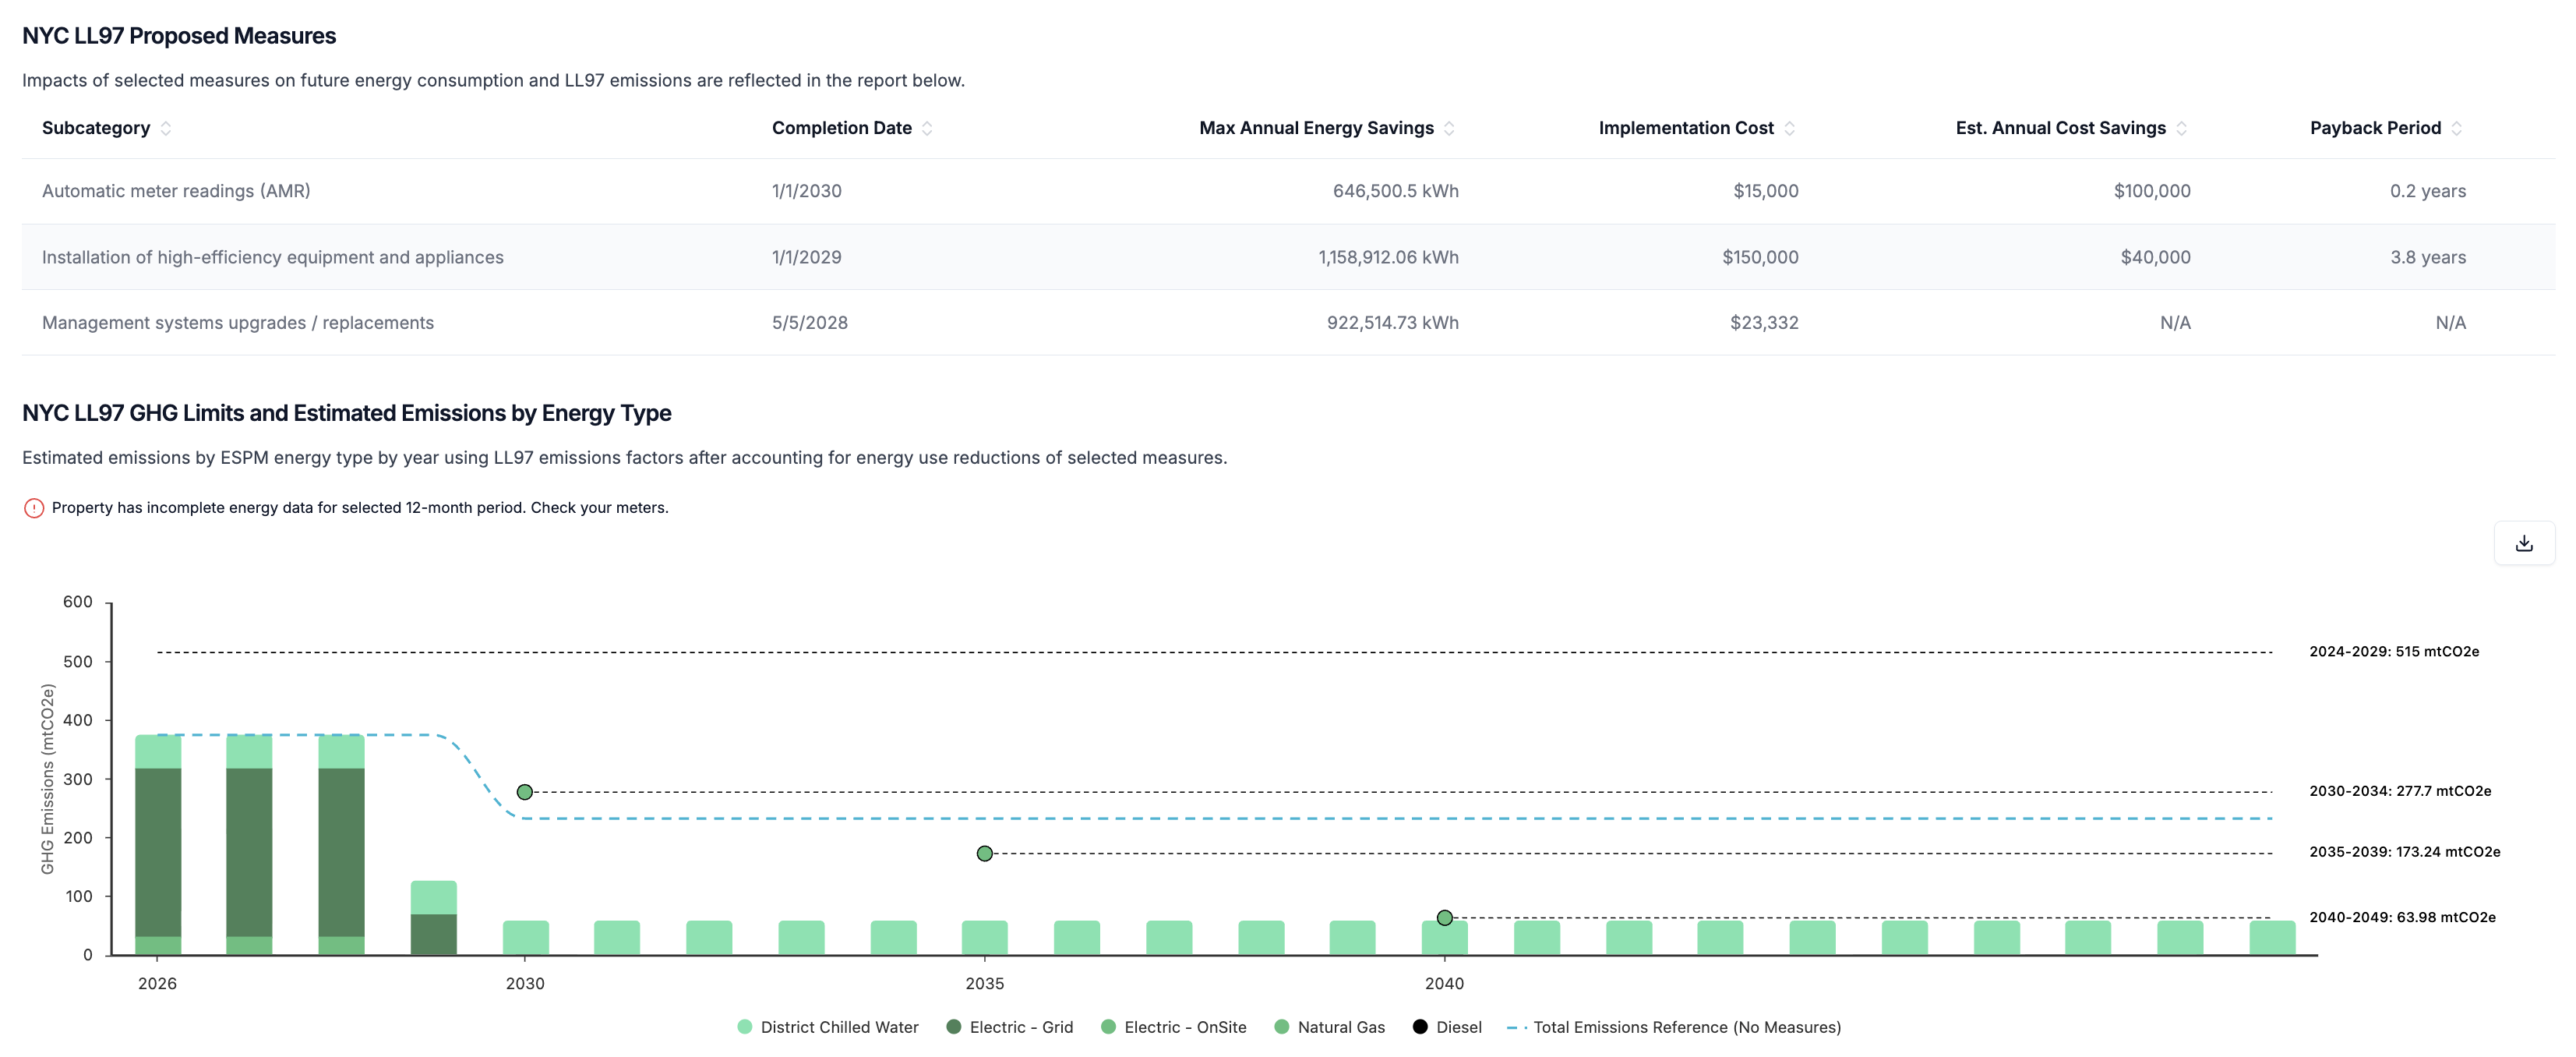 The screenshot above shows the impact of three selected measures on emissions and compliance. The measures begin to yield savings in 2029 and keep the building in compliance through 2050. **The dashed blue line represents the business-as-usual scenario.**
Impacts from measures on emissions and penalties will only show if a measure has values entered for annual energy savings:
* Absolute values entered for each energy subtype are subtracted from the total annual consumption of that subtype for the selected reporting period.
* Percentage values entered for each energy subtype are converted to absolute values by multiplying the percentage by the total annual consumption of that subtype for the selected reporting period. The converted value is then treated as an absolute value.
* Measures are applied independently (no interactive effects) and total reductions for each energy subtype are capped by the total subtype consumption of the reporting period.
* e.g. If 20 measures include 10% annual electricity savings, this will be capped to 100% annual electricity savings, resulting in 0 electricity-related emissions
* Annual energy savings are additive and persist over time
The screenshot above shows the impact of three selected measures on emissions and compliance. The measures begin to yield savings in 2029 and keep the building in compliance through 2050. **The dashed blue line represents the business-as-usual scenario.**
Impacts from measures on emissions and penalties will only show if a measure has values entered for annual energy savings:
* Absolute values entered for each energy subtype are subtracted from the total annual consumption of that subtype for the selected reporting period.
* Percentage values entered for each energy subtype are converted to absolute values by multiplying the percentage by the total annual consumption of that subtype for the selected reporting period. The converted value is then treated as an absolute value.
* Measures are applied independently (no interactive effects) and total reductions for each energy subtype are capped by the total subtype consumption of the reporting period.
* e.g. If 20 measures include 10% annual electricity savings, this will be capped to 100% annual electricity savings, resulting in 0 electricity-related emissions
* Annual energy savings are additive and persist over time
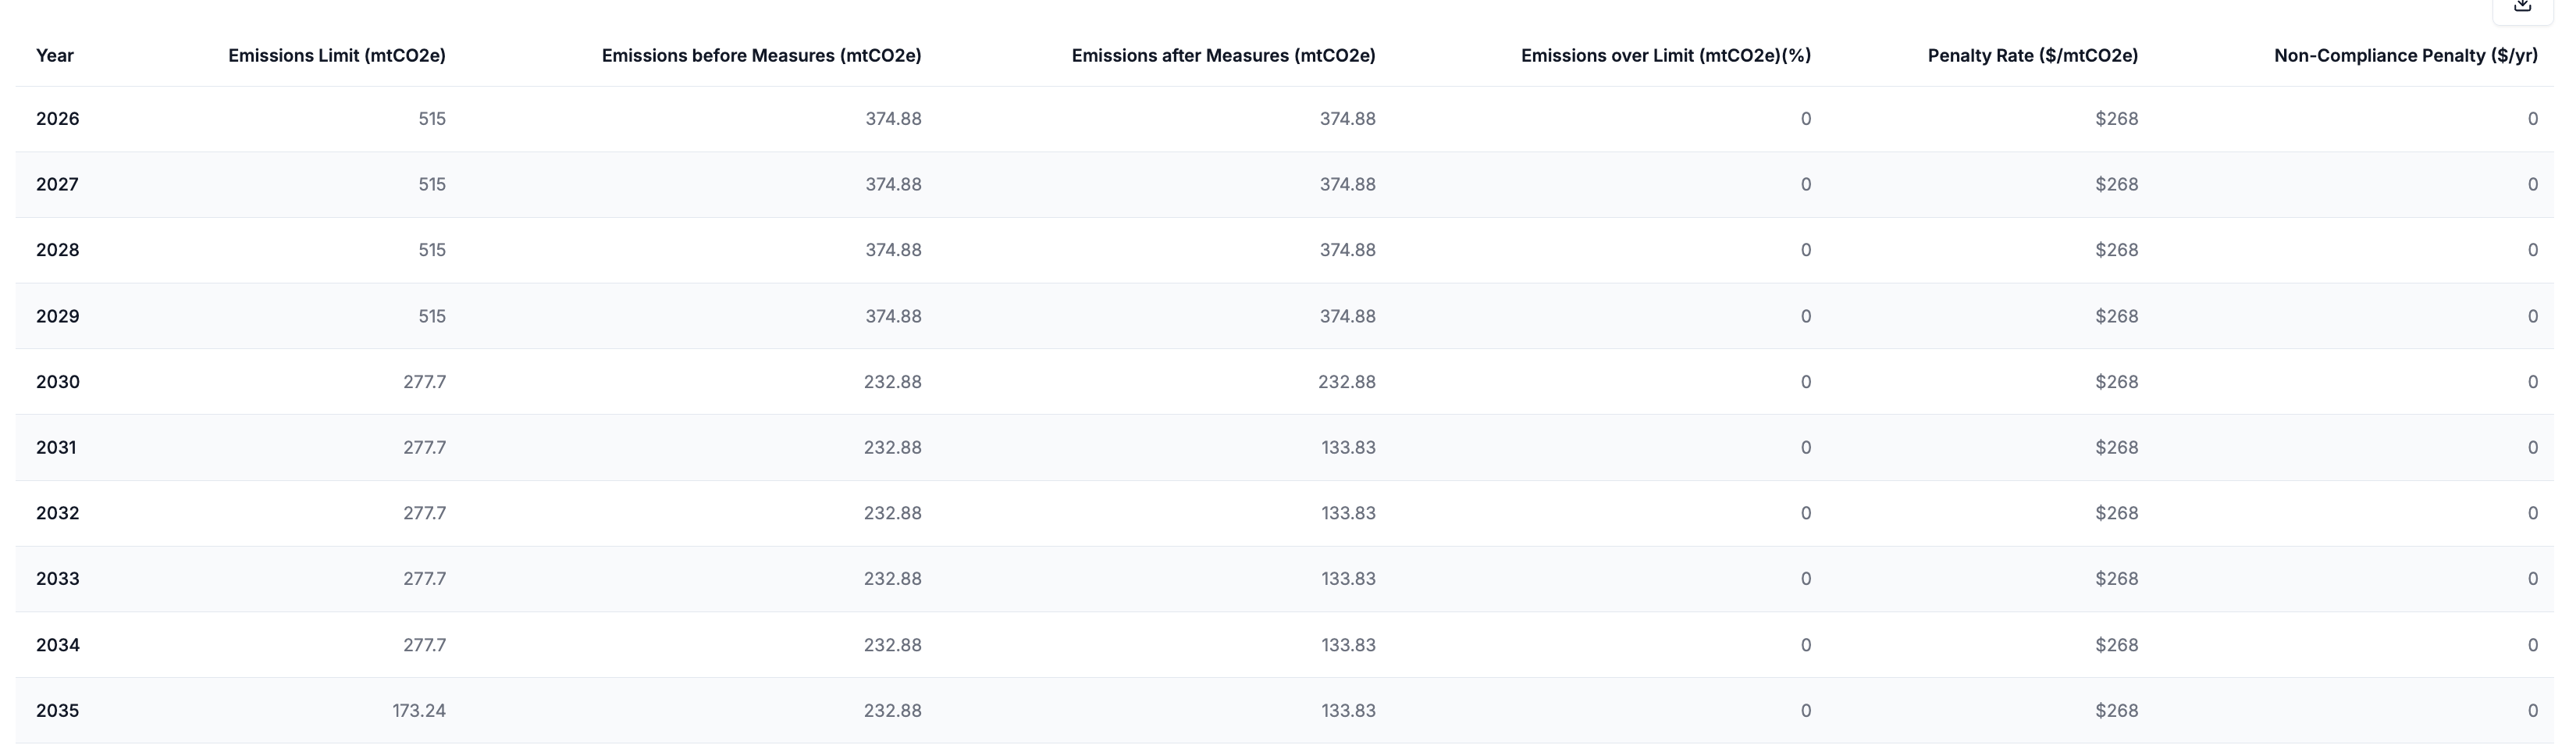 After selecting measures, the annual emissions, limits and penalty table also updates to reflect emissions and penalties before and after the completion of each selected measure.
***
## How-To Recording: Analyze Compliance
See how to review compliance, export values, set custom baselines and select measures.
After selecting measures, the annual emissions, limits and penalty table also updates to reflect emissions and penalties before and after the completion of each selected measure.
***
## How-To Recording: Analyze Compliance
See how to review compliance, export values, set custom baselines and select measures.